

Copyrights: Alparslan Koç, Alevtina Ersoy, 2024. License: This work is licensed under a Creative Commons Attribution 4.0 International License.
Abstract
Introduction: Prealbumin is a protein synthesized by the choroid plexus and liver, playing integral roles in the transport of thyroxine and retinol. Its serum levels are known to decrease in response to conditions such as inflammation, protein deficiency, end-stage liver disease, and malignancy. Notably, decreased serum prealbumin levels have been negatively correlated with the severity of stroke. Given this context, understanding factors that predict functional outcomes and mortality in stroke patients is crucial, particularly the potential role of nutritional status and prealbumin levels.
Methods: This study targeted a patient population aged 18 to 100 years who were treated for stroke. We systematically recorded levels of prealbumin, albumin, hemoglobin, and the BUN/Cre ratio at three time intervals: on admission, the 5th day, and the 9th day post-admission. In addition, we assessed the severity and functional outcomes using the NIHSS and mRS scores at admission, the 9th day, and upon discharge. Other recorded parameters included Body Mass Index (BMI), daily caloric requirements, NRS-2002 nutritional risk screening scores, chronic disease presence, length of hospital stay, history of infarction, TOAST classification, and dietary patterns. Our study included a total of 57 patients.
Results: Our findings indicate that there was no significant difference in age between nonsurviving and surviving stroke patients, although deceased patients tended to be older. Notably, prealbumin and albumin levels were significantly higher in surviving patients (p < 0.05). The BUN/Cre ratio showed no difference between the groups at the time of admission, but its values on the 5th and 9th days were significantly elevated in nonsurvivors (p < 0.01). Furthermore, our analysis revealed that an increase in prealbumin and albumin levels positively influenced patient outcomes. Conversely, higher BUN/Cre ratios and NIHSS scores were associated with poor outcomes, with these differences reaching statistical significance (p < 0.01).
Conclusion: The study established a clear association between prealbumin and albumin levels, the BUN/Cre ratio, NIHSS and mRS scores, and overall nutritional status with the functional outcomes and mortality rates in stroke patients. Our results underscore the importance of closely monitoring nutritional status and these specific biochemical markers as part of the comprehensive management of stroke patients to potentially improve their outcomes.
Introduction
In developed countries, stroke mortality ranks after ischemic heart disease and cancer1. Malnutrition represents a significant, preventable consequence impacting many stroke victims, typically defined as a protein-energy deficiency. It was reported in 16.3% of patients hospitalized with acute stroke, with this rate increasing to 26.4% by day 72. Malnutrition is associated with fatigue, muscle weakness, and the loss of muscle mass. Additionally, it causes immunosuppression, impaired intestinal function, and hospital infections3. After a stroke, levels of plasma cortisol, catecholamines, interleukins, and glucagon, along with acute phase reactants, increase as part of the acute stress response, leading to the rapid loss of muscle mass4. It has been demonstrated that just ten days of bed rest can result in a 30% decrease in muscle protein synthesis and a 6% reduction in leg muscle mass, culminating in a 16% loss of muscle strength in healthy older adults5.
Prealbumin is a protein primarily synthesized by the choroid plexus and liver, involved in the transport of thyroxine and retinol. Decreases in serum prealbumin levels, which negatively correlate with stroke severity, can be caused by inflammation, protein deficiency, end-stage liver disease, and malignancy6, 7. As it is a negative acute-phase reactant, serum concentrations of prealbumin decrease rapidly due to reduced mRNA expression8. Malnutrition is expected to occur in the acute phase of a stroke. Initial malnutrition may lead to more complications post-stroke, and it has been reported that malnutrition in the first week predicts poor outcomes for three months9. Therefore, nutritional assessment upon hospital admission and the early identification of patients at risk of malnutrition may be necessary for effective treatment. This study aimed to investigate whether the nutritional status, dietary pattern, and prealbumin levels can predict functional outcomes and mortality in stroke patients.
Methods
After obtaining approval, patients aged 18 to 100 years who were treated in the hospital for a stroke were included in the study. Patients were followed and observed for at least 10 days until discharge or death, and laboratory findings and scores were recorded. Informed consent was obtained from all patients or their relatives. In addition, prealbumin, albumin, hemoglobin, and BUN/Cre ratio were recorded on days 0, 5, and 9. The National Institutes of Health Stroke Scale (NIHSS) score and the modified Rankin scale (mRS) score were recorded on admission, on the 9th day, and at discharge. Body mass index (BMI), daily caloric requirements, chronic diseases, length of hospital stay, history of infarction, Trial of Org 10172 in Acute Stroke Treatment (TOAST) classification, dietary pattern, and nutritional risk screening (NRS-2002) scores were also recorded. Oral feeding was preferred when possible, and in patients with poor swallowing function, a nasogastric catheter was placed, and enteral nutrition was started. For patients who could not tolerate enteral nutrition, parenteral nutrition was preferred. Patients who died within ten days after hospitalization, were transferred to the intensive care unit, had liver failure or chronic renal failure, had intracranial hemorrhage, or who experienced further complications were excluded from the study.
TOAST Classification
According to this classification, patients are divided into five subtypes:
NIHSS
The NIHSS, a systematic assessment tool measuring the most common neurological deficits in acute stroke patients, includes assessments of the level of consciousness, gaze, visual field, visual impairment, motor performance of the extremities, sensory deficits, coordination (ataxia), speech (aphasia), and language (dysarthria), and assesses semiattention (neglect). The scale was created for rapid assessment of neurological function in the early post-stroke period. "A score of 0 is considered normal for all parameters, so the higher the score, the worse the neurological deficit (the highest possible score is 42)."
mRS
The mRS, used in the follow-up of stroke patients, is a scale that determines the severity of stroke and is used to identify dependency and assess functional improvement (Table 1). According to this scale, those who score 1 or 2 can continue to live independently, and those who score 3 or more can continue to live as dependents.
| Grade | 0 | 1 | 2 | 3 | 4 | 5 | 6 |
| Desription | No symptoms at all | No significant disability despite symptoms: able to carry out all usual duties and activities | Slight disability: unable to carry out all previous activities but able to look after own affairs without assistance | Moderate disability: requiring some help, but able to walk without assistance | Moderately severe disability: unable to walk without assistance, and unable to attend to own bodily needs | Severe disability: bedridden, incontinent, and requiring constant nursing care and attention | Death |
NRS-2002
The NRS-2002 scoreboard comprises three parts: disease severity, nutritional status, and age. Scores ≥3 points indicate the presence of nutritional risk and the need for nutritional therapy.
Statistical Analyses
The results are expressed as percentages for categorical variables, means for normally distributed variables, and medians (interquartile ranges) for non-normally distributed continuous variables. Continuous variables were compared using t-tests and Mann–Whitney tests, while categorical variables were compared using chi-square tests. Correlations between continuous variables were assessed with Pearson's or Spearman's rank correlation coefficient, depending on distribution status. The severity of the cerebrovascular event was classified as "no or mild (mRS score 0-2: no or only mild neurological symptoms) or severe (mRS score 3-6: moderate or severe disability)" based on the mRS score on day 9. A logistic regression model was used to examine the relationships between the measured parameters, mortality, and high mRS score. Adjusted univariate and multivariate models and reported odds ratios (ORs) and 95% confidence intervals (CIs) were used for all major outcome predictors. A binary logistic regression model that included hypertension, diabetes mellitus, history of stroke, atrial fibrillation, and TOAST subtype was used to examine the ability of these variables to predict the group status. Analyses were performed using the SPSS software package (version 26.0), and p < 0.05 was considered to indicate statistical significance.
Ethical Principles
The study was carried out in accordance with the Helsinki Declaration of 1975. The ethics committee approval number is Erzurum City Hospital, Erzurum, Turkey (Date: 20.06.2022 No: 2022/08-95).
| N | Survivor | Non-survivor | p-value | |
| Age (Mean ± SD) | 75.42 ± 12.75 | 74.08 ± 10.15 | 77.9 ± 16.55 | 0.35 |
| Male/Female | 114 (58/56) | 74 (34/40) | 40 (24/16) | 0.31 |
| BMI | 26.78 ± 3.78 | 26.66 ± 4.0 | 25.87 ± 3.1 | 0.84 |
| NRS-2002 | 3.65 ± 1.3 | 3.73 ± 1.36 | 3.5 ± 1.23 | 0.52 |
| Prealbumin 0 th day (Mean ± SD) | 0.15 ± 0.06 | 0.16 ± 0.06 | 0.13 ± 0.07 | 0.04 |
| Prealbumin 5 th day (Mean ± SD) | 0.12 ± 0.06 | 0.13 ± 0.06 | 0.10 ± 0.07 | 0.02 |
| Prealbumin 9 th day (Mean ± SD) | 0.12 ± 0.06 | 0.13 ± 0.06 | 0.09 ± 0.07 | 0.03 |
| Bun/Cre 0 th day (Mean ± SD) | 21.38 ± 7.88 | 21.49 ± 9.26 | 21.17 ± 4.53 | 0.88 |
| Bun/Cre 5 th day (Mean ± SD) | 27.26 ± 8.35 | 25.03 ± 8.31 | 3138 ± 6.86 | 0.00 |
| Bun/Cre 9 th day (Mean ± SD) | 28.51 ± 9.63 | 25.05 ± 8.82 | 34.9 ± 7.73 | 0.00 |
| Albumin 0 th day (Mean ± SD) | 36.65 ± 5.79 | 37.89 ± 4.57 | 34.36 ± 7.12 | 0.02 |
| Albumin 5 th day (Mean ± SD) | 31.23 ± 5.36 | 33.19 ± 4.13 | 27.6 ± 5.52 | 0.00 |
| Albumin 9 th day (Mean ± SD) | 29.19 ± 5.41 | 31.66 ± 4.27 | 24.64 ± 4.24 | 0.00 |
| Hemoglobin g/dL 0 th day (Mean± SD) | 13.01 ± 2.26 | 12.93 ± 2.02 | 13.18 ± 2.69 | 0.48 |
| Hemoglobin g/dL 5 th day (Mean± SD) | 12.33 ± 1.83 | 12.5 ± 1.62 | 12.02 ± 2.18 | 0.34 |
| Hemoglobin g/dL 9 th day (Mean± SD) | 11.71 ± 2.08 | 11.96 ± 1.63 | 11.24 ± 2.7 | 0.21 |
| Stay of hospital (day) | 18.56 ± 12.6 | 16.65 ± 9.5 | 22.1 ± 16.64 | 0.61 |
| Hypertension, n (%) | 74 (64.9) | 54 (72.9) | 14 (35) | 0.00 |
| Cardiovascular disease, n (%) | 30 (26.3) | 20 (27.02) | 10 (25) | 0.86 |
| Hyperlipidemia, n (%) | 8 (7) | 6 (8.1) | 2 (5) | 0.56 |
| Diabetes mellitus, n (%) | 34 (29.82) | 26 (35.13) | 8 (20) | 0.23 |
| Atrial fibrilation, n (%) | 26 (22.8) | 14 (18.91) | 12 (30) | 0.26 |
| Past cerebral enfarct, n (%) | 26 (22.8) | 16 (21.62) | 10 (25) | 0.50 |
| Methallic heart valve, n (%) | 8 (7) | 4 (5.4) | 4 (10) | 0.43 |
| tPA therapy n (%) | 38 (33.33) | 26 (35.139 | 12 (30) | 0.69 |
| Anticoagulation therapy, n (%) | 74 (64.91) | 46 (62.16) | 28 (70) | 0.55 |
| Antiplatelet therapy, n (%) | 42 (36.84) | 30 (40.5) | 12 (30) | 0.43 |
| NIHS 0 th day (Mean ± SD) | 14.18 ± 5.6 | 11.95 ± 4.87 | 18.30 ± 4.71 | 0.00 |
| NIHS 9 th day (Mean ± SD) | 12.49 ± 7.9 | 8.51 ± 6 | 19.85 ± 5.23 | 0.00 |
| NIHS discharge (Mean ± SD) | 7.3 ± 5.3 | |||
| MRS 0 th day (Mean ± SD) | 4.35 ± 0.83 | 4.14 ± 0.88 | 4.75 ± 0.55 | 0.00 |
| MRS 9 th day (Mean ± SD) | 3.77 ± 1.7 | 2.95 ± 1.49 | 5.3 ± 0.73 | 0.00 |
| MRS dischage (Mean ± SD) | 2.61 ± 1.87 | |||
| TOAST classification | ||||
| a.) Large artery, n (%) | 14 (12.3) | 10 (71.4) | 4 (37.6) | 0.00 |
| b.) Small vessels, n (%) | 28 (24.6) | 26 (92.85) | 2 (7.15) | |
| c.) Cardioembolic, n (%) | 32 (28.1) | 16 (50) | 16 (50) | |
| d.) Other cause, n (%) | 40 (47.4) | 28 (70) | 12 (30) |
| OR (95% CI) | Beta | p-value | OR | |
| Prealbumin 0 th day | 0.00 - 0.00 | -31.926 | 0.00 | -31.926 |
| Bun/Cre 9 th day | 1.007 - 1.222 | 0.104 | 0.03 | 1.110 |
| Albumin 9 th day | 0.500 - 0.856 | -0.424 | 0.02 | -0.654 |
| Hypertension | 1.555 - 16.168 | 1.612 | 0.00 | 5.014 |
| Parenteral nutrition | 4.71 - 93.944 | 3.047 | 0.00 | 21.048 |
| NIHSS 0 th day | 1.124 - 1.512 | 0.265 | 0.00 | 1.304 |
| mRS 0 th day | 1.326 - 11.108 | 1.345 | 0.01 | 3.837 |
| AUC (95% CI) | Cutt off | p-value | Sensivity (%) | Specifity (%) | |
| Negative predictors | |||||
| Prealbümin 0 th day | 0.662 (0.506 -.0818) | 0.10 | 0.045 | 86 | 40 |
| Prealbümin 5 th day | 0.686 (0.523 - 0.848) | 0.085 | 0.021 | 89 | 50 |
| Prealbümin 9 th day | 0.672 (0.513 - 0.830) | 0.075 | 0.034 | 91 | 40 |
| Albümin 0 th day | 0.657 (0.510 - 0.804) | 39.4 | 0.052 | 48 | 85 |
| Albümin 5 th day | 0.782 (0.657 - 0.906) | 32.2 | 0.000 | 59 | 85 |
| Albümin 9 th day | 0.869 (0.774 - 0.964) | 28.5 | 0.000 | 75 | 90 |
| Positive predictors | |||||
| BUN/Cre 0 th day | 0.662 (0.506 - 0.818) | 19.85 | 0.50 | 70 | 48 |
| BUN/Cre 5 th day | 0.686 (0.523 - 0.848) | 28.75 | 0.00 | 70 | 75 |
| BUN/Cre 9 th day | 0.672 (0.513 - 0.830) | 28.50 | 0.00 | 90 | 73 |
| mRS 0 th day | 0.714 (0.575 - 0.852) | 4.50 | 0.00 | 80 | 62 |
| NIHSS 0 th day | 0.822 (0.713 - 0.931) | 15.50 | 0.00 | 70 | 79 |
| AUC (95%) | Cutt-off | p-value | Sensivity (%) | Specifity (%) | |
| Negative predictors | |||||
| Prealbumin 0 th day | 0.656 (0.507 - 0.806) | 0.145 | 0.04 | 59 | 74 |
| Albumin 9 th day | 0.869 (0.774 - 0.964) | 28.5 | 0.00 | 77 | 63 |
| Positive predictors | |||||
| BUN/Cre 9 th day | 0.747 (0.615 - 0.878) | 28.50 | 0.00 | 65 | 77 |
| NIHSS 0 th day | 0.844 (0.737 - 0.950) | 12.50 | 0.00 | 80 | 77 |


Results
Among the 84 patients included in the study, 27 were excluded. Of these, 8 patients died within the first 10 days, 3 had chronic renal failure, 5 experienced intracranial hemorrhage, and 11 were admitted to the intensive care unit due to respiratory distress, sepsis, and the need for anti-edema treatment. The characteristics of the study concerning mortality are shown in Table 2.
Of the 57 patients remaining in the study, 20 died after the first 10 days of follow-up. There was no significant difference between the non-surviving and surviving patients, although the deceased patients were older. Prealbumin and albumin levels were significantly higher in surviving patients (p < 0.05). When the BUN/Cre ratio was evaluated, there was no difference in admission values. However, the values on the 5th and 9th days were significantly higher in patients who did not survive (p < 0.01). Survival was higher in patients who were enteral-fed (p < 0.01). The NIHSS score was significantly higher in patients who did not survive (p < 0.01). Compared to baseline and on the 9th day, the NIHSS score increased in patients who did not survive and decreased in patients who survived (Figure 1 a).
When considering the initial and 9th-day mRS scores, the mRS scores of the nonsurviving patients were significantly higher (p < 0.01) (Figure 1 b). According to the TOAST classification, the etiologies were cardioembolism in 20 (47.4%) cases, small vessel occlusion in 14 (24.6%), large artery atherosclerosis in 7 (12.3%), and other etiologies in 0 (0%). The size of the affected vessel was significantly associated with survival (p < 0.01). The color Doppler USG findings were as follows: atherosclerotic changes without stenosis in 42 (73.7%), symptomatic internal carotid artery (ICA) stenosis in 5 (8.8%), asymptomatic ICA in 5 (8.8%), bilateral ICA stenosis in 2 (3.5%), and not applicable in 3 patients (5.3%). There was no significant difference in carotid Doppler findings regarding survival. Only the presence of hypertension among chronic diseases was associated with mortality (p < 0.01). The results of the logistic regression model for predicting mortality are summarized in Table 3.
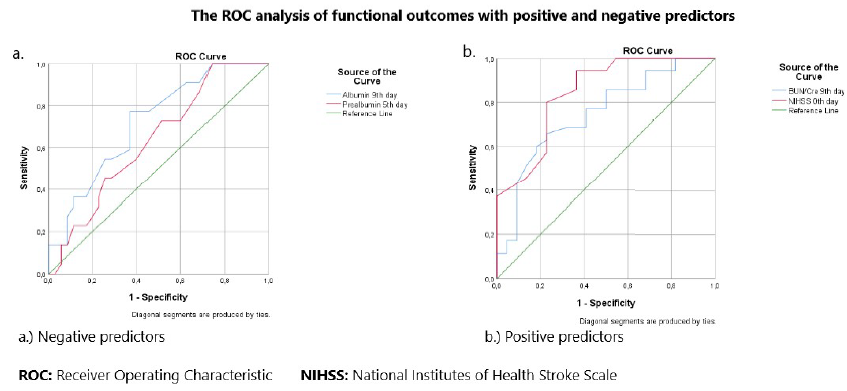
According to the ROC analysis, prealbumin was a strong predictor of mortality, with an AUC of 0.686 (95% CI 0.523-0.848) on day 5. The optimal cutoff value for predicting mortality was 0.085 g/L, with a sensitivity of 86% and specificity of 50%. The results of the ROC analysis for other independent positive and negative predictors are summarized in Table 4 and Figure 2.
Although there was no correlation between prealbumin levels and initial NIHSS scores, there was a negative, strong correlation with NIHSS scores on the 9th day (r = -0.716, p < 0.01). While there was no correlation between the BUN/Cre ratio and NIHSS score on the 0th day, there was a weak positive correlation on the 9th day (r = 0.435, p < 0.01). There was no correlation between albumin levels and NIHSS scores on the 0th day, similar to the findings for the BUN/Cre ratio. However, there was a negative correlation on the 9th day (r = -0.480, p < 0.01).
Patients were divided into two groups according to their mRS scores and evaluated separately. Those with mRS scores of 0-2 (no neurological deficit or low deficit) had a favorable outcome, whereas those with mRS scores of 3-6 (severe deficit) were classified as having unfavorable outcomes. As shown in Table 4, increases in prealbumin and albumin levels positively affected favorable outcomes. In contrast, the BUN/Cre ratio and NIHSS score had a negative effect on favorable outcomes, with a significant difference (p < 0.01). Upon examining other independent predictors, an unfavorable outcome was observed in patients with diabetes mellitus and those receiving parenteral nutrition, with the difference being significant (p < 0.05). The results of the ROC analysis of other independent positive and negative predictors are summarized in Table 5 and Figure 3.
No correlation was found between the NIHSS score or mRS score and age, BMI, NRS-2002 score, prealbumin level, BUN/Cre ratio, albumin level, or hemoglobin level when assessing the length of the hospital stay. Additionally, no difference was discovered in the TOAST classification or functional outcome.
Discussion
The definition of malnutrition, an essential preventable complication, is used to describe several nutritional abnormalities and usually refers to protein-energy inadequacy resulting from a long-term negative balance of energy and protein10. When malnutrition occurs, all fat stores are depleted, and fatty acids are released for energy. However, since fatty acids cannot cross the blood‒brain barrier, they cannot be used as an energy source for the brain. Although fatty acids produced in the liver can generate ketone bodies that can cross the blood‒brain barrier, they are not an effective energy source for neurons. In stroke patients with reduced oral intake, amino acids become an energy source during the rapid breakdown of muscle protein. This process, along with inflammation, hormonal deficits, and inactivity, leads to a clinical picture with the potential to rapidly develop sarcopenia11.
Prealbumin, a plasma protein synthesized by the liver, is an essential predictor of nutritional status. A decrease in prealbumin reflects possible inadequate nutrient intake. Previous studies have shown that low prealbumin levels are associated with poor prognosis in patients with heart failure12. Although strong evidence links malnutrition to poor outcomes in ischemic stroke patients13, few studies have connected prealbumin levels to mortality in these patients14. This article evaluates whether serum prealbumin levels influence functional outcomes and mortality in patients with cerebral infarction.
Several pathophysiological mechanisms can be proposed to explain the link between low prealbumin levels and poor outcomes. Low prealbumin levels likely lead to malnutrition and unfavorable outcomes. The transport of thyroid hormones is the basis for an intriguing hypothesis that may explain the relationship between prealbumin concentration and stroke severity. Prealbumin transports these hormones from the blood to the cerebrospinal fluid (CSF) through the blood-CSF barrier15. Experimental studies have shown that a reduction in prealbumin levels impairs cell survival after ischemic brain injury16. Therefore, during cerebral ischemia, damage to the choroid plexus and disrupted blood-CSF barrier may affect the distribution of thyroid hormones in the CSF (and eventually in brain tissue) with decreased prealbumin levels.
Studies have indicated that prealbumin levels may predict mortality in patients with heart failure17, renal failure18, and coronavirus disease 2019 (COVID-19) pneumonia19. A recent study reported an association between prealbumin levels and mortality14. In this study, we found that a decrease in prealbumin levels on days 0 and 9 significantly increased mortality.
Dehydration is a significant cause of morbidity and mortality in elderly individuals. Many stroke patients become dehydrated, worsening functional outcomes20. Dehydration can affect acutely paralyzed patients in several ways, including decreased cerebral blood flow21, increased fatigue22, and impaired neuroplasticity23. Another hypothesis is that dehydration increases blood viscosity and reduces cerebral blood flow due to decreased intravascular volume. Increased hematocrit has been associated with a larger infarct volume in patients with cerebral infarction24. A BUN/Cr ratio ≥20 is a standard laboratory test indicating prerenal azotemia and dehydration. Previous studies have reported an increased BUN/Cr ratio in acute cerebral infarction patients. A BUN/Cr ratio greater than 15 may be a novel predictor of stroke progression25. In our study, we evaluated the BUN/Cr ratios. Although the baseline values were not associated with mortality, the follow-up BUN/Cr ratios were associated with mortality.
Albumin, synthesized by the liver, serves as a transporter of endogenous and exogenous substances in the blood. It has neuroprotective effects in animal models of ischemic stroke26. A recent study showed that decreased albumin levels might be associated with mortality in stroke patients27. Our study revealed that low albumin levels were associated with mortality, similar to the findings in these studies. The literature has shown that malnutrition in stroke patients can be linked with mortality28. Although the association between nutritional status and mortality has not been definitively established in the literature, we found a greater survival rate in patients who received enteral nutrition.
We found that high NIHSS scores increased mortality. Some studies support these findings29, 30, 31. The strong negative correlation (r=-0.716, p < 0.01) between prealbumin levels and NIHSS scores in our correlation analysis supports our hypothesis. High mRS scores at admission were associated with mortality. The findings of Deljavan et al. support this hypothesis32.
We found that high prealbumin and albumin levels positively affected brain functions, which we classified using the mRS score after stroke. In their study, Heifeng et al. reported that low prealbumin and albumin levels were associated with unfavorable outcomes33. An increase in the BUN/Cr ratio was associated with an unfavorable outcome. Eizenberg et al. came to similar conclusions34, attributing this result to low intravascular volume. Wu et al., in their study, reported that high NIHSS scores were associated with poor cerebral function35. Similarly, high NIHSS scores in this study significantly affected the loss of cerebral function. Although sex and age were not found to be associated with unfavorable outcomes in our study, there are studies on poor cerebral function in older women after stroke36, 37. Xiaomin et al. also concluded that patients who received enteral nutrition had lower unfavorable outcomes than those who received parenteral nutrition, as we found in our study38.
Our study has several limitations. It was conducted in a single hospital, and our study cohort was limited to a small group. Only hypotheses were tested, and the sample size was relatively small, which could further limit the generalizability of the results. Future research with larger, diverse cohorts would be beneficial to confirm these observations and further elucidate the mechanisms. Despite these limitations, our study assessed mortality and functional outcomes and drew meaningful conclusions.
Conclusion
In this study, we found that prealbumin, albumin levels, the BUN/Cr ratio, NIHSS, mRS scores, and nutritional status were associated with functional outcomes and mortality, confirming the results of previous studies. We believe these results will be helpful in risk stratification in stroke patients. Although the nutrition team is constantly vigilant, the patient's family's inadequate knowledge of care procedures may have influenced the selection of nutrition forms. Future studies with larger datasets will determine which variables are most important concerning mortality and functional outcomes.
Abbreviations
AUC: Area Under the Curve, BMI: Body Mass Index, BUN/Cre: Blood Urea Nitrogen/Creatinine, CI: Confidence Interval, COVID-19: Coronavirus Disease 19, CSF: Cerebrospinal Fluid, ICA: Internal Carotid Artery, mRNA: Messenger Ribonucleic Acid, mRS: modified Rankin scale, NIHSS: National Institutes of Health Stroke Scale, NRS-2002: Nutritional Risk Screening 2002, ORs: Odds Ratios, ROC: Receiver Operating Characteristic, SPSS: Statistical Package for the Social Sciences, TOAST: Trial of Org 10172 in Acute Stroke Treatment, USG: Ultrasonography
Acknowledgments
None
Author’s contributions
Koç A.: developed the procedure, analyzed the main data, interpreted the results, wrote the initial draft of the paper, and finalized the manuscript. Ersoy A.: performed the clinical portion of the study and sample collection. All authors have read and approved the final version of the article.
Funding
None
Availability of data and materials
Data and materials used and/or analyzed during the current study are available from the corresponding author on reasonable request.
Ethics approval and consent to participate
The study was carried out in accordance with the Helsinki Declaration of 1975. The ethics committee approval number is Erzurum City Hospital, Erzurum, Turkey (Date: 20.06.2022 No: 2022/08-95. Before initiating any procedures, all patients provided informed consent by signing the appropriate documentation.
Consent for publication
Not applicable.
Competing interests
The authors declare that they have no competing interests.
References
-
Scherbakov
N.,
Doehner
W.,
Sarcopenia in stroke-facts and numbers on muscle loss accounting for disability after stroke. Journal of Cachexia, Sarcopenia and Muscle.
2011;
2
(1)
:
5-8
.
View Article PubMed Google Scholar -
Kim
S.,
Byeon
Y.,
Comparison of nutritional status indicators according to feeding methods in patients with acute stroke. Nutritional Neuroscience.
2014;
17
(3)
:
138-44
.
View Article PubMed Google Scholar -
Klempir
J.,
Sarbochova
I.,
Ruzickova
L.,
Bezuchova
E.,
Gal
O.,
Srp
M.,
Guidelines for nutritional support in stroke. Czech and Slovak Neurology and Neurosurgery..
2020;
83
(6)
:
667-73
.
-
Arsava
E.M.,
Aydoğdu
İ.,
Güngör
L.,
Iş\ikay
C.T.,
Yaka
E.,
Nutritional Approach and Treatment in Patients with Stroke, An Expert Opinion for Turkey. Turk Noroloji Dergisi.
2018;
24
(3)
:
226-42
.
View Article Google Scholar -
Kortebein
P.,
Ferrando
A.,
Lombeida
J.,
Wolfe
R.,
Evans
W.J.,
Effect of 10 days of bed rest on skeletal muscle in healthy older adults. Journal of the American Medical Association.
2007;
297
(16)
:
1772-4
.
View Article PubMed Google Scholar -
a
Y. Ingenbleek,
V. Young,
Transthyretin (prealbumin) in health and disease: nutritional implications. Annual review of nutrition.
1994;
14
(1)
:
495-533
.
View Article PubMed Google Scholar -
Chang
K.C.,
Lee
H.C.,
Huang
Y.C.,
Hung
J.W.,
Chiu
H.E.,
Chen
J.J.,
Cost-effectiveness analysis of stroke management under a universal health insurance system. Journal of the Neurological Sciences.
2012;
323
(1-2)
:
205-15
.
View Article PubMed Google Scholar -
Myron Johnson
A.,
Merlini
G.,
Sheldon
J.,
Ichihara
K.,
Scientific Division Committee on Plasma Proteins (C-PP)
International Federation of Clinical Chemistry,
Laboratory Medicine (IFCC)
Clinical indications for plasma protein assays: transthyretin (prealbumin) in inflammation and malnutrition. Clinical Chemistry and Laboratory Medicine.
2007;
45
(3)
:
419-26
.
View Article PubMed Google Scholar -
Yoo
S.H.,
Kim
J.S.,
Kwon
S.U.,
Yun
S.C.,
Koh
J.Y.,
Kang
D.W.,
Undernutrition as a predictor of poor clinical outcomes in acute ischemic stroke patients. Archives of Neurology.
2008;
65
(1)
:
39-43
.
View Article PubMed Google Scholar -
Corrigan
M.L.,
Escuro
A.A.,
Celestin
J.,
Kirby
D.F.,
Nutrition in the stroke patient. Nutrition in clinical practice : official publication of the American Society for Parenteral and Enteral Nutrition.
2011;
26
(3)
:
242-52
.
View Article Google Scholar -
Hasselbalch
S.G.,
Knudsen
G.M.,
Jakobsen
J.,
Hageman
L.P.,
Holm
S.,
Paulson
O.B.,
Brain metabolism during short-term starvation in humans. Journal of Cerebral Blood Flow and Metabolism.
1994;
14
(1)
:
125-31
.
View Article PubMed Google Scholar -
Wang
W.,
Ren
D.,
Wang
C.S.,
Li
T.,
Yao
H.C.,
High sensitivity C-reactive protein to prealbumin ratio measurement as a marker of the prognosis in acute coronary syndrome. Scientific Reports.
2019;
9
(1)
:
11583
.
View Article PubMed Google Scholar -
Shen
H.C.,
Chen
H.F.,
Peng
L.N.,
Lin
M.H.,
Chen
L.K.,
Liang
C.K.,
Impact of nutritional status on long-term functional outcomes of post-acute stroke patients in Taiwan. Archives of Gerontology and Geriatrics.
2011;
53
(2)
:
e149-52
.
View Article PubMed Google Scholar -
Ambrosius
W.,
Michalak
S.,
Kazmierski
R.,
Andrzejewska
N.,
Kozubski
W.,
Predictive value of serum transthyretin for outcome in acute ischemic stroke. PLoS One.
2017;
12
(6)
:
e0179806
.
View Article PubMed Google Scholar -
Richardson
S.J.,
Wijayagunaratne
R.C.,
D'Souza
D.G.,
Darras
V.M.,
Van Herck
S.L.,
Transport of thyroid hormones via the choroid plexus into the brain: the roles of transthyretin and thyroid hormone transmembrane transporters. Frontiers in Neuroscience.
2015;
9
:
66
.
View Article PubMed Google Scholar -
Santos
S.D.,
Lambertsen
K.L.,
Clausen
B.H.,
Akinc
A.,
Alvarez
R.,
Finsen
B.,
CSF transthyretin neuroprotection in a mouse model of brain ischemia. Journal of Neurochemistry.
2010;
115
(6)
:
1434-44
.
View Article PubMed Google Scholar -
Han
S.,
Wang
C.,
Tong
F.,
Li
Y.,
Li
Z.,
Sun
Z.,
Value of the Neutrophils/Prealbumin Ratio and Its Combination With the GWTG-HF Score in Predicting In-Hospital Mortality in Patients With Heart Failure. The American Journal of Cardiology.
2022;
172
:
62-7
.
View Article PubMed Google Scholar -
Nguyen Huu
D.,
Dao Bui Quy
Q.,
Nguyen Minh
T.,
Nguyen Duc
L.,
Truong Dinh
C.,
Trung
K.N.,
Low serum prealbumin concentration predicts long-term mortality in maintenance hemodialysis patients with hepatitis B and/or C virus infections. JGH Open: An Open Access Journal of Gastroenterology and Hepatology.
2021;
5
(12)
:
1344-50
.
View Article PubMed Google Scholar -
Zuo
P.,
Tong
S.,
Yan
Q.,
Cheng
L.,
Li
Y.,
Song
K.,
Decreased prealbumin level is associated with increased risk for mortality in elderly hospitalized patients with COVID-19. Nutrition (Burbank, Los Angeles County, Calif.).
2020;
78
:
110930
.
View Article PubMed Google Scholar -
Rodriguez
G.J.,
Cordina
S.M.,
Vazquez
G.,
Suri
M.F.,
Kirmani
J.F.,
Ezzeddine
M.A.,
The hydration influence on the risk of stroke (THIRST) study. Neurocritical Care.
2009;
10
(2)
:
187-94
.
View Article PubMed Google Scholar -
Hillis
A.E.,
Ulatowski
J.A.,
Barker
P.B.,
Torbey
M.,
Ziai
W.,
Beauchamp
N.J.,
A pilot randomized trial of induced blood pressure elevation: effects on function and focal perfusion in acute and subacute stroke. Cerebrovascular Diseases (Basel, Switzerland).
2003;
16
(3)
:
236-46
.
View Article PubMed Google Scholar -
Acciarresi
M.,
Bogousslavsky
J.,
Paciaroni
M.,
Post-stroke fatigue: epidemiology, clinical characteristics and treatment. European Neurology.
2014;
72
(5-6)
:
255-61
.
View Article PubMed Google Scholar -
Ogren
S.O.,
Central serotonin neurones in avoidance learning: interactions with noradrenaline and dopamine neurones. Pharmacology, Biochemistry, and Behavior.
1985;
23
(1)
:
107-23
.
View Article PubMed Google Scholar -
Harrison
M.J.,
Pollock
S.,
Kendall
B.E.,
Marshall
J.,
Effect of haematocrit on carotid stenosis and cerebral infarction. Lancet.
1981;
2
(8238)
:
114-5
.
View Article PubMed Google Scholar -
Schrock
J.W.,
Glasenapp
M.,
Drogell
K.,
Elevated blood urea nitrogen/creatinine ratio is associated with poor outcome in patients with ischemic stroke. Clinical Neurology and Neurosurgery.
2012;
114
(7)
:
881-4
.
View Article PubMed Google Scholar -
Idicula
T.T.,
Waje-Andreassen
U.,
Brogger
J.,
Naess
H.,
Thomassen
L.,
Serum albumin in ischemic stroke patients: the higher the better. The Bergen Stroke Study. Cerebrovascular Diseases (Basel, Switzerland).
2009;
28
(1)
:
13-7
.
View Article PubMed Google Scholar -
Kocatürk
M.,
Kocatürk
Ö.,
Assessment of relationship between C-reactive protein to albumin ratio and 90-day mortality in patients with acute ischaemic stroke. Neurologia i Neurochirurgia Polska.
2019;
53
(3)
:
205-11
.
PubMed Google Scholar -
Hao
R.,
Qi
X.,
Xia
X.,
Wang
L.,
Li
X.,
Malnutrition on admission increases the in-hospital mortality and length of stay in elder adults with acute ischemic stroke. Journal of Clinical Laboratory Analysis.
2022;
36
(1)
:
e24132
.
View Article PubMed Google Scholar -
Magdon-Ismail
Z.,
Ledneva
T.,
Sun
M.,
Schwamm
L.H.,
Sherman
B.,
Qian
F.,
Factors associated with 1-year mortality after discharge for acute stroke: what matters?. Topics in Stroke Rehabilitation.
2018;
25
(8)
:
576-83
.
View Article PubMed Google Scholar -
Algin
A.,
Inan
I.,
The role of radiologic, clinical and biochemical parameters in prediction of stroke mortality. Neurosciences (Riyadh).
2019;
24
(2)
:
110-4
.
View Article PubMed Google Scholar -
Olum
S.,
Muyingo
A.,
Wilson
T.L.,
Demaerschalk
B.M.,
Hoxworth
J.M.,
Zhang
N.,
Stroke Mortality Outcomes in Uganda. Journal of stroke and cerebrovascular diseases : the official journal of National Stroke Association.
2021;
30
(5)
:
105661
.
View Article Google Scholar -
Deljavan
R.,
Farhoudi
M.,
Sadeghi-Bazargani
H.,
Stroke in-hospital survival and its predictors: the first results from Tabriz Stroke Registry of Iran. International Journal of General Medicine.
2018;
11
:
233-40
.
View Article PubMed Google Scholar -
Mao
H.,
Wu
Q.,
Lin
P.,
Mo
J.,
Jiang
H.,
Lin
S.,
Derivation of a Prediction Rule for Unfavorable Outcome after Ischemic Stroke in the Chinese Population. Journal of Stroke and Cerebrovascular Diseases.
2019;
28
(1)
:
133-41
.
View Article PubMed Google Scholar -
Eizenberg
Y.,
Grossman
E.,
Tanne
D.,
Koton
S.,
Admission Hydration Status and Ischemic Stroke Outcome-Experience from a National Registry of Hospitalized Stroke Patients. Journal of Clinical Medicine.
2021;
10
(15)
:
3292
.
View Article PubMed Google Scholar -
Wu
Z.,
Zeng
M.,
Li
C.,
Qiu
H.,
Feng
H.,
Xu
X.,
Time-dependence of NIHSS in predicting functional outcome of patients with acute ischemic stroke treated with intravenous thrombolysis. Postgraduate Medical Journal.
2019;
95
(1122)
:
181-6
.
View Article PubMed Google Scholar -
Phan
H.T.,
Blizzard
C.L.,
Reeves
M.J.,
Thrift
A.G.,
Cadilhac
D.A.,
Sturm
J.,
Factors contributing to sex differences in functional outcomes and participation after stroke. Neurology.
2018;
90
(22)
:
e1945-53
.
View Article PubMed Google Scholar -
Roy-O'Reilly
M.,
McCullough
L.D.,
Age and Sex Are Critical Factors in Ischemic Stroke Pathology. Endocrinology.
2018;
159
(8)
:
3120-31
.
View Article PubMed Google Scholar -
Li
X.,
Yang
Y.,
Ma
Z.F.,
Gao
S.,
Ning
Y.,
Zhao
L.,
Enteral combined with parenteral nutrition improves clinical outcomes in patients with traumatic brain injury. Nutritional Neuroscience.
2022;
25
(3)
:
530-6
.
View Article PubMed Google Scholar
Comments
Article Details
Volume & Issue : Vol 11 No 7 (2024)
Page No.: 6573-6582
Published on: 2024-07-31
Citations
Copyrights & License
This work is licensed under a Creative Commons Attribution 4.0 International License.
Search Panel
- HTML viewed - 2626 times
- PDF downloaded - 798 times
- XML downloaded - 87 times
