

Copyrights: Utkarsh Pancholi, Vijay Dave, 2024. License: This work is licensed under a Creative Commons Attribution 4.0 International License.
Abstract
Objective: This study analyzed polarity-specific changes in the electric field (E-field) and the focal point of tDCS stimulation for both High-Definition tDCS (HD-tDCS) and reverse HD-tDCS considering the head geometry of Mild Cognitive Impairment (MCI) patients. The distance between the left preauricular (LPA) and right preauricular points as well as the inion and nasion were calculated in 3D to measure correlations.
Methods: T1-weighted structural MRI images were obtained from the Alzheimer's Disease Neuroimaging Initiative (ADNI). We utilized SimNIBS 3.2.6 for MRI image processing, 3D head model generation, application of HD-tDCS and reverse HD-tDCS, E-field analysis, and other relevant parameters.
Results: Electric field analysis was conducted on all 10 MCI subjects to examine the distribution and focality of the peak electric field. Despite using uniform stimulation for all subjects, variation was observed in the peak electric field (at the 99.9th, 99th, and 95th percentiles) and focality (at the 75th and 50th percentiles). However, the peak electric field and focality values remained consistent when comparing HD-tDCS and reverse HD-tDCS. The only differing quantities were associated with the normal component influenced by the changing direction of the current in HD-tDCS and reverse HD-tDCS.
Conclusion: HD-tDCS and reverse HD-tDCS exhibited distinct values for the electric field strength and focality. HD-tDCS demonstrated more positive fields and inflow current compared to reverse HD-tDCS, making it suitable for excitatory effects. Conversely, reverse HD-tDCS would be more appropriate for inhibitory effects due to the prevalence of more negative fields and outflow current.
Introduction
Mild cognitive impairment (MCI) refers to a state of both physiological and psychological decline that affects cognitive and memory-related functions in the elderly population. According to the World Health Organization, an estimated 426 million individuals will be over the age of 60 by the year 20501. MCI, as a symptomatic neurodegenerative disorder, is categorized into amnestic (affecting short-term memory in the prefrontal cortex) and non-amnestic (impaired problem-solving, visual perception, language formation, attention, and concentration) conditions that progressively worsen over time. To diagnose and confirm the clinical presence of MCI, laboratory tests are conducted to measure various hormone levels (e.g., thyroid hormone2), examine blood and urine for infections3, and analyze cerebrospinal fluid4 to assess autoimmune conditions related to neurodegenerative diseases. Additional diagnostic approaches encompass imaging methods such as Magnetic Resonance Imaging (MRI)5, amyloid scans using Positron Emission Tomography (PET)6, and Computed Tomography (CT)7. Neuropsychological assessments such as the Montreal Cognitive Assessment (MoCA) are also utilized for diagnosis8. Despite the absence of compelling evidence and approved medications for MCI treatment9, clinicians have proposed alternative therapies such as physical activity, dietary and nutritional interventions, and behavioral therapy10. Depression, anxiety, disinterest, and aggression are recognized as co-occurring symptoms in conjunction with the clinically observed manifestations of MCI11. The symptoms of depression vary across age groups, with manifestations including sadness and irritability in young children, while memory issues, fatigue, and suicidal thoughts are more prevalent in adults and older individuals. When cognitive impairments (non-amnestic) accompany depression, the severity of the disease increases, and the likelihood of progression to dementia becomes more significant within five years of MCI onset12.
The electrostimulation method known as transcranial direct current stimulation (tDCS) has gained popularity among psychiatrists and other medical practitioners specializing in the treatment of neurodegenerative conditions such as depression, MCI, and Alzheimer's disease (AD). Early research findings have shown encouraging outcomes, particularly in the treatment of depression using anodal stimulation and addressing hyperactive brain disorders (e.g., mania) with cathodal stimulation13, 14. As a non-invasive therapeutic approach, tDCS modifies neuronal activity to produce its therapeutic effects, increasing the excitability of neuronal cells without inducing action potentials. The objective of this therapy is to modify brain function and improve cognitive abilities in patients with neurological and psychological conditions. tDCS utilizes a direct current of 1-2 mA delivered to the scalp through bipolar or multiple stimulating metal electrodes. The therapist has the flexibility to adjust the current intensity, location, duration, and polarity of electrodes based on the individual needs of the patient. Bipolar stimulation involves a two-electrode method where one electrode serves as the active stimulator (anode) placed on the target area of the brain, while the other electrode functions as the cathode and is typically positioned in an extracephelic region15. The placement of these electrodes determines the inward current (at the anode) and outward current (at the cathode), leading to depolarization and repolarization of the neural mass, respectively. The resistance of head tissues such as the skin, scalp, skull, white matter, and grey matter reduces the intensity of the current and the focusing of the electrical field as it penetrates deeper regions of the brain. This direct current, reaching various tissues of the head, affects the electric field strength (measured in V/m) in both the targeted area and its surrounding regions16. The electric field strength and focality are influenced differently by stimulation parameters such as the intensity17, size, and shape of the electrode18, the target location, the duration of stimulation, and the conductivity of head tissues19.
There are two methods of delivering currents to the head: bipolar stimulation and HD-tDCS. Bipolar stimulation involves the use of two stimulating electrodes (the anode and cathode), while HD-tDCS employs multiple electrodes (such as 3×1, three anodes and one cathode, or 4×1, four anodes and one cathode). When using bipolar stimulation on opposite hemispheres, with one electrode on the left and the other on the right hemisphere, the electric field strength becomes less focused due to the current flowing from the anode to the cathode and passing through multiple brain tissues. However, focality can be improved by using a finer diameter electrode located on the same hemisphere. In their study, Datta et al. conducted a comparison between conventional bipolar and HD-tDCS electrode configurations, and the results revealed that the 4×1 HD-tDCS demonstrated increased focality and enhanced electric field strength in the targeted area compared to its counterpart20. Gaurav Sharma et al. conducted simulations of bipolar stimulation using electrodes of varying sizes (4×4, 3×3, and 2×2 cm2, with a sponge electrode thickness of 2.0 mm and a conductive gel thickness of 0.50 mm). They then compared these results with the HD-tDCS configuration (specifically, 4×1 with one anode and four cathodes) using four different electrode locations with Montreal Neurologic Institute coordinates (MNI)21. Their findings indicated that the focality was greater using the HD-tDCS electrode placement method compared to the bipolar configuration. Edgard Morya et al. conducted a review of the effects of transcutaneous spinal direct current stimulation (ts-DCS) and cerebellar tDCS, and the results showed improvements in alleviating symptoms of neurological disorders, providing pain relief, and enhancing cognitive and rehabilitative motor functions when using HD-tDCS22. The majority of the research conducted on HD-tDCS has emphasized its focality compared to conventional bipolar tDCS, where all four electrodes are equidistant from the central electrode. To date, only anodal HD-tDCS stimulation has been reported, with findings related to the electric field strength and its spatial characteristics. However, there is insufficient data available regarding the effects of reversing the direction of the current (anodal to cathodal) for MCI patients.
In this research, we conducted simulations of both anodal and cathodal 4×1 HD-tDCS in MCI patients, targeting the frontal cortex to address cognitive decline with symptoms of depression. The study's objectives were as follows: 1) Creating a high-precision 3D head model using SimNIBS 3.2.6; 2) Simulating the 3D head model with the 4×1 anodal and cathodal HD-tDCS configurations; 3) Determining the patient-specific relative distance from the central electrode (anodal or cathodal); 4) Evaluating the relative distance between the Iz and Nz (inion and nasion) and the RPA and LPA (Right pre-auricle point and left pre-auricle point) to characterize the geometrical changes in patients; 5) Analyzing the incoming and outgoing current at the normal axis to the current stimulation.
Methods
Computational methods are employed to visualize various characteristics of the electric field, such as the E-field strength, spatial distribution, intensity, current density, and their components at the normal axis. In-situ platforms such as COMSOL Multiphysics and Solidworks are utilized for customizing 3D head modeling and E-field analysis. Additionally, dedicated software packages such as Simulation of Non-invasive Brain Stimulation (SimNIBS), Computation of the Electric field due to Transcranial current Stimulation (COMET), SPHEARE, and ROAST (a fully automated, realistic, volumetric approach to simulate transcranial electric stimulation) are available for tDCS modeling and analysis23. For our study, we utilized SimNIBS 3.2.6 for MRI image processing, 3D head model generation, the application of HD-tDCS and reversed HD-tDCS, E-field analysis, and other relevant parameters. Figure 1 illustrates the processing pipeline for the tDCS simulation employed in our work.

Structural MRI
Structural MRI enables the comprehensive visualization of the entire head anatomy, encompassing the dimensions, configuration, and integrity of different brain structures, including the cerebral cortex, white matter, grey matter, and deeper regions of the brain. MRI images are typically essential for detecting any structural abnormalities within the brain and are commonly used for prognosis and assessing the effects of treatment over time. Structural MRI scans employ T1 and T2-weighted imaging sequences. T1-weighted images are valuable for revealing anatomical structures with clear contrast, allowing differentiation between gray matter and white matter in the brain, identifying lesions or tumors, and evaluating normal tissue morphology24, 25. T2-weighted images are useful for examining conditions that entail fluid accumulation or edema, detecting issues such as inflammation, infection, or tumors, and assessing specific abnormalities such as white matter lesions in cases of multiple sclerosis26.
We obtained T1-weighted structural images from the Alzheimer's Disease Neuroimaging Initiative (ADNI) for ten MCI patients (eight males and two females, median age: 71 years). The imaging protocol for all the images included the following specifications: acquisition plane=sagittal; acquisition type = coil =sense-head; field strength = 3.0 tesla; flip angle = 8.0 degrees; manufacturer = Philips Medical Systems; matrix x = 256.0 pixels; matrix y = 256.0 pixels; matrix z = 170.0; mfg. model = Intera; pixel spacing x =1.0 mm; pixel spacing y =1.0 mm; pulse sequence = GR; slice thickness = 1.2 mm; TE=3.2 ms; TI = 0.0 ms; TR=6.8 ms, and weighting = t127.
3D Head model
The process of 3D head modeling, also referred to as volume conductor modeling, was accomplished using the headreco segmentation pipeline within SimNIBS 3.2.6. This command line pipeline generates a finite element mesh (FEM) by allocating voxels to distinct head tissue classes. Headreco utilizes statistical parametric mapping (SPM 12) and computational anatomy toolbox (CAT 12) for the surface reconstruction of the brain's grey matter28. The headreco generates 0.5 nodes per mm3 of volume, and this resolution can be adjusted as needed, either increased or decreased. For this study, ten head models were created corresponding to the ten MCI patients selected for analysis.

| Sr. No. | Subject ID | Sex | Age | Fiducials Points | Distance between Nz & Iz (mm) | Iz | LPA | Distance between LPA & RPA (mm) | RPA | ||||||||
|---|---|---|---|---|---|---|---|---|---|---|---|---|---|---|---|---|---|
| Nz | X | Y | Z | X | Y | Z | X | Y | Z | ||||||||
| X | Y | Z | |||||||||||||||
| 1 | Sub_01 | F | 70 | 3.23 | 99.57 | -14.85 | 185.98 | -9.81 | -84.43 | -38.62 | -74.39 | 10.48 | -31.80 | 142.09 | 66.95 | 2.27 | -43.86 |
| 2 | Sub_02 | M | 83 | -3.53 | 108.78 | 4.92 | 227.33 | -14.72 | -98.15 | -88.51 | -87.53 | 11.98 | -50.79 | 159.97 | 72.21 | 3.48 | -49.44 |
| 3 | Sub_03 | M | 79 | -7.22 | 116.35 | -37.60 | 203.67 | 8.67 | -59.17 | -139.69 | -74.49 | 21.73 | -88.35 | 152.77 | 76.18 | 44.31 | -99.63 |
| 4 | Sub_04 | M | 69 | -8.50 | 99.07 | -11.61 | 187.06 | -1.40 | -87.74 | -18.14 | -77.67 | 1.66 | -24.90 | 146.55 | 68.87 | 2.15 | -25.64 |
| 5 | Sub_05 | F | 55 | 2.64 | 84.50 | -16.30 | 173.82 | -4.85 | -89.03 | -9.54 | -67.49 | 1.54 | -22.67 | 134.74 | 66.75 | -9.98 | -21.72 |
| 6 | Sub_06 | M | 75 | 2.13 | 110.66 | 6.39 | 204.90 | -1.34 | -82.67 | -61.39 | -79.93 | 14.11 | -34.63 | 159.79 | 79.74 | 11.68 | -40.48 |
| 7 | Sub_07 | M | 56 | 7.60 | 105.32 | -3.10 | 200.00 | -3.45 | -94.14 | -12.81 | -75.13 | 8.43 | -15.18 | 154.98 | 79.44 | -1.42 | -20.70 |
| 8 | Sub_08 | M | 67 | 3.72 | 110.92 | -0.98 | 207.21 | 0.83 | -90.39 | -49.98 | -78.34 | 9.01 | -30.65 | 160.00 | 81.39 | 9.54 | -39.85 |
| 9 | Sub_09 | M | 77 | 1.23 | 130.20 | -17.95 | 202.71 | -1.85 | -65.32 | -71.40 | -75.90 | 35.95 | -59.09 | 154.44 | 78.24 | 28.95 | -52.50 |
| 10 | Sub_10 | M | 79 | 0.94 | 114.11 | 4.38 | 216.77 | 0.90 | -96.90 | -45.27 | -78.47 | 9.12 | -24.50 | 157.25 | 78.41 | 11.09 | -35.11 |
| Total distance | 2009.45 | 1522.57 | |||||||||||||||
| Average distance | 200.95 | 152.26 | |||||||||||||||
| Sr. No. | Subject ID | Sex | Age | Distance between central electrode and other four electrodes (mm) | |||
|---|---|---|---|---|---|---|---|
| F3-AF3 | F3-F1 | F3-FC3 | F3-F5 | ||||
| 1 | Sub_01 | F | 70 | 29.843503 | 24.238601 | 31.237139 | 24.156866 |
| 2 | Sub_02 | M | 83 | 33.49835 | 27.007443 | 34.903726 | 26.785181 |
| 3 | Sub_03 | M | 79 | 31.078774 | 25.95485 | 33.746791 | 23.92078 |
| 4 | Sub_04 | M | 69 | 30.603582 | 26.031338 | 32.085855 | 23.97301 |
| 5 | Sub_05 | F | 55 | 28.148209 | 24.3985 | 30.402423 | 23.962548 |
| 6 | Sub_06 | M | 75 | 31.568736 | 27.063116 | 34.785291 | 26.114197 |
| 7 | Sub_07 | M | 56 | 33.1169 | 26.292112 | 34.797158 | 26.098594 |
| 8 | Sub_08 | M | 67 | 33.145992 | 28.121298 | 35.029023 | 26.144385 |
| 9 | Sub_09 | M | 77 | 32.185293 | 27.183191 | 34.010225 | 26.331693 |
| 10 | Sub_10 | M | 79 | 33.877842 | 27.504808 | 36.312091 | 25.536077 |
| Total | 317.067181 | 263.795257 | 306.072583 | 253.023331 | |||
| Average | 31.7067181 | 26.3795257 | 30.6072583 | 25.3023331 | |||
HD-tDCS placement
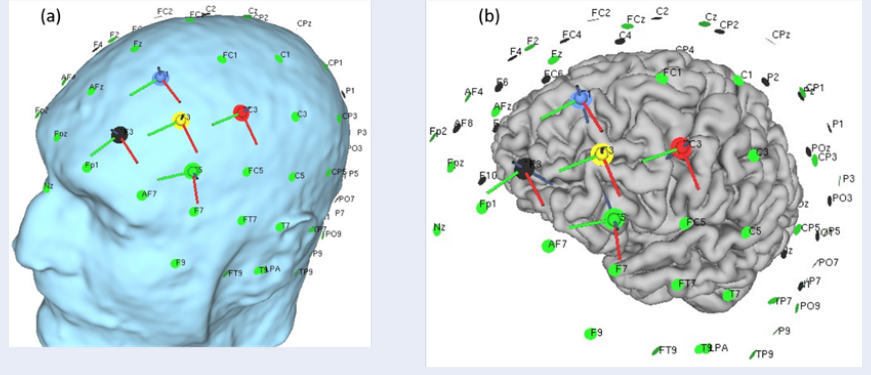
tDCS is a well-known therapeutic approach involving a conventional protocol with two electrodes (bipolar) stimulating the targeted brain area. These electrodes consist of one anode (positive) and one cathode (negative) with precise sizes and shapes. In our study, we employed HD-tDCS and reversed HD-tDCS configurations to investigate the changes in the electric field distribution and input/output current in the targeted brain region. Since depression is one of the symptoms of MCI patients, we selected the frontal lobe as the target area. Two stimulation protocols were used: 1) 4×1 anodal stimulation with one anode and four cathodes, and 2) 4×1 cathodal stimulation with one cathode and four anodes. We adopted the 10-20 electrode placement method used in electroencephalography to determine the positions of the stimulating electrodes. In the first protocol, F3 served as the anode, while AF3, F1, FC3, and F5 acted as cathodes. In the second protocol, F3 acted as the cathode, while AF3, F1, FC3, and F5 served as anodes. The electrode morphology was round, with a diameter of 1.0 cm and a thickness of 5 mm. The anode current was set at 2 mA, and the cathode current was set at 0.500 mA. We calculated the distance of each electrode from the central anodal or cathodal electrode. Additionally, the distance between the inion and nasion was measured using fiducial points. Figure 2 illustrates the HD-tDCS placement on the head scalp (a) and the gray matter (b). Table 1 and Table 2 list the distances between the inion-nasion and LPA-RPA and the distances of each electrode from the central electrode, respectively.
E-field analysis
To anticipate the stimulation effects and investigate potential side effects, the spatial extent and intensity of the electric field (E-field) in various brain regions were analyzed and visualized using gmsh. The governing equations for the electrical current flow in tDCS are rooted in the principles of electrostatics. Two fundamental equations are utilized: Ohm's law and Laplace's equation. Ohm's law links the electric current (I) flowing through a conductor to the voltage (V) across it and the resistance (R) it offers. In the context of tDCS, the current flows through the head and brain tissues, and Ohm's law can be locally applied at each point. The current (I) is expressed as σ · E, where I represents the electric current density vector (A/m²); σ is the conductivity of the medium (S/m), and E denotes the electric field vector (V/m). Laplace's equation characterizes the distribution of electric potential (V) in a region without charge density. In tDCS, the equation governs the behavior of the electric potential throughout the head and brain tissues. The electric potential (∇²V) is equal to zero, where ∇² represents the Laplacian operator (∂²/∂x² + ∂²/∂y² + ∂²/∂z²), and V signifies the electric potential (V). These equations, along with appropriate boundary conditions, serve as the foundation for the computational modeling of tDCS. The electric field (E-field) distribution can be derived from the electric potential (V) using the relationship E = -∇V, where ∇ signifies the gradient operator (∂/∂x, ∂/∂y, ∂/∂z)29, 30.
E-normal and J-normal component analysis
In tDCS, researchers frequently analyze the E-normal (electric field normal) and J-normal (current density normal) components to assess the impact of stimulation on neuronal activity and the potential for neural modulation. These components offer valuable information concerning the direction and strength of the electric field and current density in relation to the brain's surface. The E-normal component specifically refers to the electric field vector that is perpendicular to the brain's surface, indicating the direction and intensity of the electric field relative to the underlying neural tissue. Through the examination of the E-normal component, both the spatial extent and strength of the electric field at the brain's surface can be determined. This information is significant, as it aids in comprehending the areas most impacted by tDCS, enabling precise electrode placement to target specific brain regions. The J-normal component pertains to the current density vector perpendicular to the brain's surface, indicating the flow of electrical current through neural tissue in that direction. Examining the J-normal component offers valuable information about the distribution and strength of the current density at the brain's surface, shedding light on how the electrical current is distributed within the brain tissue and its effects on neuronal activity.
Results
Electric field analysis was conducted on all 10 MCI subjects to examine the distribution and focality of the peak electric field. Despite using uniform stimulation for all subjects, variation was observed in the peak electric field (at the 99.9th, 99th, and 95th percentiles) and focality (at the 75th and 50th percentiles). However, when comparing HD-tDCS and reversed HD-tDCS, the peak electric field and focality values remained constant (Table 3). The only differing quantities were associated with the normal component, which was influenced by the changing direction of the current in HD-tDCS and reversed HD-tDCS. The average peak electric field for the normal component, Norm E, was 1.62E-01 at the 99.9th percentile, 9.65E-02 at the 99th percentile, and 3.44E-02 at the 95th percentile. For the normal component, Norm J, the average peak electric field was 4.46E-02 at the 99.9th percentile, 2.65E-02 at the 99th percentile, and 9.48E-03 at the 95th percentile. The focality for Norm E was 3.00E+03 at the 75th percentile and 9.55E+03 at the 50th percentile; for Norm J, this was 3.00E+03 at the 75th percentile and 9.55E+03 at the 50th percentile.


Columns 6 to 15 in Table 4 and Table 5 display the normal components of the E vector representing the peak electric fields for E-normal (measured in V/m) and J-normal (measured in A/m²). The letter "P" signifies positive values, indicating the incoming electric field entering the surface, while "N" denotes negative values, indicating the outgoing electric field leaving the surface. Figure 3 illustrates the different components of the E vector. For HD-tDCS, the average values of E-normal entering the surface were 1.24E-01 V/m at the 99.9th percentile, 5.89E-02 V/m at the 99th percentile, and 1.16E-02 V/m at the 95th percentile. As for J-normal, the average values entering the surface were 3.40E-02 V/m at the 99.9th percentile, 1.62E-02 V/m at the 99th percentile, and 3.19E-03 V/m at the 95th percentile. Regarding reversed HD-tDCS, the average values of E-normal entering the surface were 1.24E-01 V/m at the 99.9th percentile, 5.89E-02 V/m at the 99th percentile, and 1.16E-02 V/m at the 95th percentile. For J-normal, the average values entering the surface were 8.70E-02 V/m at the 99.9th percentile, 4.01E-02 V/m at the 99th percentile, and 1.16E-02 V/m at the 95th percentile. The focality values for E-normal were 6.38E+02 V/m at the 75th percentile and 1.78E+03 V/m at the 50th percentile for both HD-tDCS and reversed HD-tDCS. Similarly, the focality values for J-normal were 6.38E+02 V/m at the 75 percentile and 1.78E+03 V/m at the 50th percentile for both HD-tDCS and reversed HD-tDCS.
The average values of E-normal exiting the surface were -9.30E-02 V/m at the 99.9th percentile, -4.28E-02 V/m at the 99th percentile, and -1.22E-02 V/m at the 95th percentile for HD-tDCS. As for J-normal, the average values entering the surface were -2.56E-02 V/m at the 99.9th percentile, -1.18E-02 V/m at the 99th percentile, and -3.35E-03 V/m at the 95th percentile for HD-tDCS. In contrast, the average values of E-normal entering the surface were -1.15E-01 V/m at the 99.9th percentile, -5.48E-02 V/m at the 99th percentile, and 1.16E-02 V/m at the 95th percentile for reversed HD-tDCS. As for J-normal, the average values entering the surface were 8.70E-02 V/m at the 99.9th percentile, 4.01E-02 V/m at the 99th percentile, and -1.11E-02 V/m at the 95th percentile for reversed HD-tDCS. Regarding focality values, for E-normal, these were 5.84E+02 V/m at the 75th percentile and 1.69E+03 V/m at the 50th percentile for HD-tDCS, and 6.26E+02 V/m at the 75th percentile and 1.76E+03 V/m at the 50th percentile for reversed HD-tDCS. As for J-normal, the focality values were 6.38E+02 V/m at the 75th percentile and 1.78E+03 V/m at the 50th percentile for both HD-tDCS and reversed HD-tDCS. Figure 4 illustrates the head models and various components, including E-field, E-normal for HD-tDCS, and reversed HD-tDCS, as well as J-normal for HD-tDCS and reversed HD-tDCS.


| Sr. No. | Subject ID | Sex | HD-tDCS and reversed HD-tDCS | ||||||||||
| Age | Peak electric field (V/m) | Focality (mm3) | |||||||||||
| Norm E (V/m) | Norm J (A/m2) | Norm E | Norm J | ||||||||||
| 99.9 | 99 | 95 | 99.9 | 99 | 95 | 75 | 50 | 75 | 50 | ||||
| 1 | Sub_1 | F | 70 | 1.13E-01 | 6.42E-02 | 2.68E-02 | 3.10E-02 | 1.76E-02 | 7.37E-03 | 1.32E+03 | 6.71E+03 | 1.32E+03 | 6.71E+03 |
| 2 | Sub_2 | M | 83 | 9.44E-02 | 6.91E-02 | 2.81E-02 | 2.60E-02 | 1.90E-02 | 7.72E-03 | 5.36E+03 | 1.69E+04 | 5.36E+03 | 1.69E+04 |
| 3 | Sub_3 | M | 79 | 2.13E-01 | 1.16E-01 | 3.52E-02 | 5.86E-02 | 3.19E-02 | 9.69E-03 | 3.04E+03 | 7.48E+03 | 3.04E+03 | 7.48E+03 |
| 4 | Sub_4 | M | 69 | 2.91E-01 | 1.67E-01 | 5.43E-02 | 8.00E-02 | 4.60E-02 | 1.49E-02 | 2.76E+03 | 8.29E+03 | 2.76E+03 | 8.29E+03 |
| 5 | Sub_5 | F | 55 | 2.46E-01 | 1.50E-01 | 4.60E-02 | 6.78E-02 | 4.14E-02 | 1.27E-02 | 2.61E+03 | 7.15E+03 | 2.61E+03 | 7.15E+03 |
| 6 | Sub_6 | M | 75 | 7.24E-02 | 4.30E-02 | 1.99E-02 | 1.99E-02 | 1.18E-02 | 5.49E-03 | 2.15E+03 | 9.04E+03 | 2.15E+03 | 9.04E+03 |
| 7 | Sub_7 | M | 56 | 1.99E-01 | 1.20E-01 | 4.17E-02 | 5.48E-02 | 3.29E-02 | 1.15E-02 | 3.12E+03 | 1.04E+04 | 3.12E+03 | 1.04E+04 |
| 8 | Sub_8 | M | 67 | 1.36E-01 | 9.16E-02 | 3.21E-02 | 3.74E-02 | 2.52E-02 | 8.83E-03 | 4.36E+03 | 1.28E+04 | 4.36E+03 | 1.28E+04 |
| 9 | Sub_9 | M | 77 | 1.63E-01 | 8.38E-02 | 3.66E-02 | 4.47E-02 | 2.30E-02 | 1.01E-02 | 2.49E+03 | 7.01E+03 | 2.49E+03 | 7.01E+03 |
| 10 | Sub_10 | M | 79 | 9.53E-02 | 5.98E-02 | 2.35E-02 | 2.62E-02 | 1.65E-02 | 6.47E-03 | 2.80E+03 | 9.71E+03 | 2.80E+03 | 9.71E+03 |
| Total | 710 | 1.62E+00 | 9.65E-01 | 3.44E-01 | 4.46E-01 | 2.65E-01 | 9.48E-02 | 3.00E+04 | 9.55E+04 | 3.00E+04 | 9.55E+04 | ||
| Average | 71 | 1.62E-01 | 9.65E-02 | 3.44E-02 | 4.46E-02 | 2.65E-02 | 9.48E-03 | 3.00E+03 | 9.55E+03 | 3.00E+03 | 9.55E+03 | ||
| Sr. No. | Subject ID | Sex | Age | Positive & Negative values | Simulation-1 (HD-tDCS) | |||||||||
| Peak electric field (V/m) | Focality | |||||||||||||
| E- normal (V/m) | J-normal (A/m2) | E- normal (V/m) | J-normal (A/m2) | |||||||||||
| 99.9 | 99 | 95 | 99.9 | 99 | 95 | 75 | 50 | 75 | 50 | |||||
| 1 | Sub_1 | F | 70 | 7.79E-02 | 4.23E-02 | 1.17E-02 | 2.14E-02 | 1.16E-02 | 3.23E-03 | 5.14E+02 | 1.71E+03 | 5.14E+02 | 1.71E+03 | |
| -5.43E-02 | -2.91E-02 | -1.11E-02 | -1.49E-02 | -8.00E-03 | -3.04E-03 | 4.43E+02 | 1.70E+03 | 4.43E+02 | 1.70E+03 | |||||
| 2 | Sub_2 | M | 83 | 7.79E-02 | 4.36E-02 | 9.35E-03 | 2.14E-02 | 1.20E-02 | 2.57E-03 | 8.64E+02 | 2.21E+03 | 8.64E+02 | 2.21E+03 | |
| -5.89E-02 | -3.15E-02 | -9.31E-03 | -1.62E-02 | -8.67E-03 | -2.56E-03 | 7.28E+02 | 2.09E+03 | 7.28E+02 | 2.09E+03 | |||||
| 3 | Sub_3 | M | 79 | 1.63E-01 | 7.08E-02 | 1.03E-02 | 4.49E-02 | 1.95E-02 | 2.84E-03 | 4.53E+02 | 1.34E+03 | 4.53E+02 | 1.34E+03 | |
| -1.13E-01 | -5.33E-02 | -1.24E-02 | -3.11E-02 | -1.46E-02 | -3.41E-03 | 5.49E+02 | 1.57E+03 | 5.49E+02 | 1.57E+03 | |||||
| 4 | Sub_4 | M | 69 | 2.12E-01 | 9.50E-02 | 1.79E-02 | 5.83E-02 | 2.61E-02 | 4.93E-03 | 6.13E+02 | 1.57E+03 | 6.13E+02 | 1.57E+03 | |
| -1.75E-01 | -6.82E-02 | -1.88E-02 | -4.82E-02 | -1.88E-02 | -5.17E-03 | 4.91E+02 | 1.17E+03 | 4.91E+02 | 1.17E+03 | |||||
| 5 | Sub_5 | F | 55 | 1.98E-01 | 9.24E-02 | 1.38E-02 | 5.46E-02 | 2.54E-02 | 3.80E-03 | 6.00E+02 | 1.40E+03 | 6.00E+02 | 1.40E+03 | |
| -1.57E-01 | -7.15E-02 | -1.70E-02 | -4.32E-02 | -1.97E-02 | -4.67E-03 | 4.92E+02 | 1.35E+03 | 4.92E+02 | 1.35E+03 | |||||
| 6 | Sub_6 | M | 75 | 5.65E-02 | 2.75E-02 | 7.48E-03 | 1.55E-02 | 7.55E-03 | 2.06E-03 | 5.45E+02 | 1.79E+03 | 5.45E+02 | 1.79E+03 | |
| -4.39E-02 | -2.06E-02 | -7.11E-03 | -1.21E-02 | -5.66E-03 | -1.96E-03 | 5.44E+02 | 1.68E+03 | 5.44E+02 | 1.68E+03 | |||||
| -1.04E-01 | -4.82E-02 | -1.31E-02 | -2.86E-02 | -1.32E-02 | -3.61E-03 | 7.00E+02 | 1.93E+03 | 7.00E+02 | 1.93E+03 | |||||
| 8 | Sub_8 | M | 67 | 1.00E-01 | 5.24E-02 | 1.06E-02 | 2.76E-02 | 1.44E-02 | 2.92E-03 | 8.86E+02 | 2.32E+03 | 8.86E+02 | 2.32E+03 | |
| -7.49E-02 | -3.64E-02 | -1.08E-02 | -2.06E-02 | -1.00E-02 | -2.98E-03 | 7.26E+02 | 2.00E+03 | 7.26E+02 | 2.00E+03 | |||||
| 9 | Sub_9 | M | 77 | 1.21E-01 | 5.26E-02 | 1.24E-02 | 3.33E-02 | 1.45E-02 | 3.42E-03 | 4.65E+02 | 1.45E+03 | 4.65E+02 | 1.45E+03 | |
| -8.83E-02 | -3.86E-02 | -1.24E-02 | -2.43E-02 | -1.06E-02 | -3.42E-03 | 5.25E+02 | 1.48E+03 | 5.25E+02 | 1.48E+03 | |||||
| 10 | Sub_10 | M | 79 | 8.17E-02 | 4.31E-02 | 1.04E-02 | 2.25E-02 | 1.19E-02 | 2.87E-03 | 7.81E+02 | 2.02E+03 | 7.81E+02 | 2.02E+03 | |
| -6.06E-02 | -3.10E-02 | -9.77E-03 | -1.67E-02 | -8.52E-03 | -2.69E-03 | 6.46E+02 | 1.89E+03 | 6.46E+02 | 1.89E+03 | |||||
| Sr. No. | Subject ID | Sex | Age | Positive & Negative values | Simulation-2 (Reversed HD-tDCS) | |||||||||
| Peak electric field (V/m) | Focality | |||||||||||||
| E- normal (V/m) | J-normal (A/m2) | E- normal (V/m) | J-normal (A/m2) | |||||||||||
| 99.9 | 99 | 95 | 99.9 | 99 | 95 | 75 | 50 | 75 | 50 | |||||
| 1 | Sub_1 | F | 70 | 5.43E-02 | 2.91E-02 | 1.11E-02 | 1.49E-02 | 8.00E-03 | 3.04E-03 | 4.47E+02 | 1.70E+03 | 4.47E+02 | 1.70E+03 | |
| -7.80E-02 | -4.23E-02 | -1.17E-02 | -2.14E-02 | -1.16E-02 | -3.23E-03 | 5.14E+02 | 1.71E+03 | 5.14E+02 | 1.71E+03 | |||||
| 2 | Sub_2 | M | 83 | 5.89E-02 | 3.15E-02 | 9.31E-03 | 1.62E-02 | 8.66E-03 | 2.56E-03 | 7.30E+02 | 2.09E+03 | 7.30E+02 | 2.09E+03 | |
| -7.79E-02 | -4.36E-02 | -9.35E-03 | -2.14E-02 | -1.20E-02 | -2.57E-03 | 8.63E+02 | 2.21E+03 | 8.63E+02 | 2.21E+03 | |||||
| 3 | Sub_3 | M | 79 | 1.13E-01 | 5.33E-02 | 1.24E-02 | 3.11E-02 | 1.46E-02 | 3.41E-03 | 5.49E+02 | 1.57E+03 | 5.49E+02 | 1.57E+03 | |
| -1.63E-01 | -7.09E-02 | -1.03E-02 | -4.50E-02 | -1.95E-02 | -2.84E-03 | 4.53E+02 | 1.34E+03 | 4.53E+02 | 1.34E+03 | |||||
| 4 | Sub_4 | M | 69 | 1.75E-01 | 6.82E-02 | 1.88E-02 | 4.81E-02 | 1.87E-02 | 5.17E-03 | 4.91E+02 | 1.17E+03 | 4.91E+02 | 1.17E+03 | |
| -2.12E-01 | -9.50E-02 | -1.79E-02 | -5.84E-02 | -2.61E-02 | -4.93E-03 | 6.12E+02 | 1.57E+03 | 6.12E+02 | 1.57E+03 | |||||
| 5 | Sub_5 | F | 55 | 1.57E-01 | 7.14E-02 | 1.70E-02 | 4.31E-02 | 1.96E-02 | 4.67E-03 | 4.92E+02 | 1.35E+03 | 4.92E+02 | 1.35E+03 | |
| -1.99E-01 | -9.26E-02 | -1.38E-02 | -5.46E-02 | -2.55E-02 | -3.80E-03 | 5.98E+02 | 1.39E+03 | 5.98E+02 | 1.39E+03 | |||||
| 6 | Sub_6 | M | 75 | 4.39E-02 | 2.06E-02 | 7.11E-03 | 1.21E-02 | 5.65E-03 | 1.96E-03 | 5.44E+02 | 1.68E+03 | 5.44E+02 | 1.68E+03 | |
| -5.65E-02 | -2.75E-02 | -7.49E-03 | -1.55E-02 | -7.55E-03 | -2.06E-03 | 5.45E+02 | 1.79E+03 | 5.45E+02 | 1.79E+03 | |||||
| 7 | Sub_7 | M | 56 | 4.39E-02 | 2.06E-02 | 7.11E-03 | 1.21E-02 | 5.65E-03 | 1.96E-03 | 5.44E+02 | 1.68E+03 | 5.44E+02 | 1.68E+03 | |
| -5.65E-02 | -2.75E-02 | -7.49E-03 | -1.55E-02 | -7.55E-03 | -2.06E-03 | 5.45E+02 | 1.79E+03 | 5.45E+02 | 1.79E+03 | |||||
| 8 | Sub_8 | M | 67 | 7.49E-02 | 3.64E-02 | 1.08E-02 | 2.06E-02 | 1.00E-02 | 2.98E-03 | 7.28E+02 | 2.00E+03 | 7.28E+02 | 2.00E+03 | |
| -1.00E-01 | -5.24E-02 | -1.06E-02 | -2.76E-02 | -1.44E-02 | -2.92E-03 | 8.84E+02 | 2.31E+03 | 8.84E+02 | 2.31E+03 | |||||
| 9 | Sub_9 | M | 77 | 8.83E-02 | 3.86E-02 | 1.24E-02 | 2.43E-02 | 1.06E-02 | 3.42E-03 | 5.25E+02 | 1.48E+03 | 5.25E+02 | 1.48E+03 | |
| -1.22E-01 | -5.26E-02 | -1.24E-02 | -3.34E-02 | -1.45E-02 | -3.42E-03 | 4.63E+02 | 1.44E+03 | 4.63E+02 | 1.44E+03 | |||||
| 10 | Sub_10 | M | 79 | 6.06E-02 | 3.10E-02 | 9.77E-03 | 1.67E-02 | 8.52E-03 | 2.69E-03 | 6.46E+02 | 1.89E+03 | 6.46E+02 | 1.89E+03 | |
| -8.18E-02 | -4.31E-02 | -1.04E-02 | -2.25E-02 | -1.19E-02 | -2.87E-03 | 7.80E+02 | 2.01E+03 | 7.80E+02 | 2.01E+03 | |||||
Discussion
The data obtained from simulations showed variation among all subjects with the same stimulation protocols due to individual differences in age and head geometry. There appears to be no correlation between age and head geometry. The calculated distance for the most aged subject between the nasion and inion was 227.33 mm, while the distance between the right pre-auricular point (RPA) and left pre-auricular point (LPA) was 159.97 mm. The average distance between the inion and nasion, based on fiducial points, was 200.9452 mm, and between RPA and LPA was 152.2565 mm. Additionally, the distance between the central electrode and the surrounding four electrodes varied, but there were no correlations between head geometry and the corresponding electric field strength with their E-normal and J-normal components. Figure 4 and Figure 5 display the electric field strength and current density for all 10 MCI subjects. Among all subjects, significantly high electric field values (norm-E) were observed using HD-tDCS and reversed HD-tDCS, with values of 1.62E-01 V/m at the 99.9th percentile, 9.65E-02 V/m at the 99th percentile, and 3.44E-02 V/m at the 95th percentile. Similarly, the current density values followed a decreasing order at the 99.9th (4.46E-02 A/m²), 99 (2.65E-02 A/m²), and 95th (9.48E-03 A/m²) percentiles. However, no significant relationships or dependencies were observed between age, head geometry, and the distance between electrodes in MCI subjects, as the progression of the disease was unknown. Contrasting the values of norm E and norm J, the peak values for focality showed an increasing order at the 75th and 50th percentiles, with values of 3.00E+03 V/m and 9.55E+03 V/m for norm E and 3.00E+03 V/m and 9.55E+03 V/m for norm J, as depicted in Figure 6a and Figure 5 b.
The average normal values of the E vector were consistently lower than the total E-field obtained, with values of 1.24E+00 V/m, 5.89E-01 V/m, and 1.16E-01 V/m for the 99.5th, 99th, and 95th percentiles, respectively, for E-normal (Figure 7a and Figure 6 b). The same applied to the current density. In HD-tDCS, there were more positive values, indicating a greater inflow of voltage and current compared to reversed HD-tDCS. Conversely, in reversed HD-tDCS, there were more negative values, suggesting a higher outflow of current and voltage compared to HD-tDCS, (Figure 8 a and Figure 7 b).
Conclusion
The electric field is affected by multiple factors, including electrode size, shape, tissue conductivity, and current distribution pattern. A smaller diameter of the electrode generates a more focused electric field distribution. The distribution of the electric field in the brain is intricate and relies on various factors, including the electrode arrangement and the head's conductivity profile. It is essential to understand that the specific current density and stimulation parameters utilized in tDCS can differ based on the particular study, the targeted brain region, and individual characteristics. HD-tDCS and reversed HD-tDCS exhibit distinct values for electric field strength and focality. In HD-tDCS, we observed more positive fields and inflow current compared to reversed HD-tDCS, making it suitable for excitatory effects. Conversely, reversed HD-tDCS is more appropriate for inhibitory effects due to the prevalence of more negative fields and outflow current. In this study, we focused specifically on individuals with MCI. The outcomes may vary among subjects. Additional subjects can be included to further investigate the uniformity and variance of the electric field and focality for MCI or other neurological disorders.
Abbreviations
3D: Three dimensional, AD: Alzheimer's disease, CAT: Computational anatomy toolbox, COMET: Computation of Electric field due to Transcranial current Stimulation, EEG: Electroencephalograph, GR: Gradient (Pulse Sequence), HD-tDCS: High-Definition tDCS, Iz: Inion, LPA: Left pre-auricle, mA: Milli ampere, MCI: Mild Cognitive Impairment, MNI: Montreal Neurologic Institute, MoCA: Montreal Cognitive Assessment, MRI: Magnetic Resonance Imaging, Nz: Nasion, PET: Positron Emission Tomography, ROAST: A fully automated, Realistic, volumetric approach to simulate transcranial electric stimulation, RPA: Right pre-auricle, SimNIBS: Simulation of Non-invasive brain stimulation, SPM: Statistical parametric mapping, tDCS: Transcranial direct current stimulation, TE: Echo Time, TI: Inversion Time, TR: Repetition Time, ts-DCS: Transcutaneous spinal direct current stimulation, V/m: Volts per meter
Acknowledgments
We would like to express our sincere gratitude to the reviewers for their valuable feedback and insightful comments on our research paper. Their constructive criticism and thoughtful suggestions have greatly contributed to the improvement and refinement of this manuscript. We also thank the editorial team for their meticulous handling of our submission and for facilitating the peer review process.
Author’s contributions
Utkarsh Pancholi conducted the experiments, collected and analyzed the data, and drafted the initial manuscript. Both authors contributed to the interpretation of the results, provided critical revisions, and played a key role in finalizing the manuscript. As a corresponding author Vijay Dave has coordinated the collaboration between co-authors, ensuring everyone was informed of the manuscript's status, revisions needed, and deadlines, thereby fostering a cohesive team effort. All authors read and approved the final manuscript.
Funding
None.
Availability of data and materials
Data and materials used and/or analyzed during the current study are available from the corresponding author on reasonable request.
Ethics approval and consent to participate
Not applicable.
Consent for publication
Not applicable.
Competing interests
The authors declare that they have no competing interests.
References
-
Ageing and health [Internet]. [cited 2023 Jul 4]. Available from: https://www.who.int/news-room/fact-sheets/detail/ageing-and-health.
.
-
Parsaik
A.K.,
Singh
B.,
Roberts
R.O.,
Pankratz
S.,
Edwards
K.K.,
Geda
Y.E.,
Hypothyroidism and risk of mild cognitive impairment in elderly persons: a population-based study. JAMA Neurology.
2014;
71
(2)
:
201-7
.
View Article PubMed Google Scholar -
Wang
Y.,
Pan
F.,
Xie
F.,
He
R.,
Guo
Q.,
Correlation Between Urine Formaldehyde and Cognitive Abilities in the Clinical Spectrum of Alzheimer's Disease. Frontiers in Aging Neuroscience.
2022;
14
.
View Article PubMed Google Scholar -
Papaliagkas
V.,
Kalinderi
K.,
Vareltzis
P.,
Moraitou
D.,
Papamitsou
T.,
Chatzidimitriou
M.,
CSF Biomarkers in the Early Diagnosis of Mild Cognitive Impairment and Alzheimer’s Disease. International Journal of Molecular Sciences.
2023;
24
(10)
:
8976
.
View Article Google Scholar -
Chandra
A.,
Dervenoulas
G.,
Politis
M.,
Alzheimer's Disease Neuroimaging Initiative
Magnetic resonance imaging in Alzheimer's disease and mild cognitive impairment. Journal of Neurology.
2019;
266
(6)
:
1293-302
.
View Article PubMed Google Scholar -
Teng
L.,
Li
Y.,
Zhao
Y.,
Hu
T.,
Zhang
Z.,
Yao
Z.,
Alzheimer' s Disease Neuroimaging Initiative (ADNI)
Predicting MCI progression with FDG-PET and cognitive scores: a longitudinal study. BMC Neurology.
2020;
20
(1)
:
148
.
View Article PubMed Google Scholar -
Narayanan
L.,
Murray
A.D.,
What can imaging tell us about cognitive impairment and dementia?. World Journal of Radiology.
2016;
8
(3)
:
240-54
.
View Article PubMed Google Scholar -
Hobson
J.,
The Montreal Cognitive Assessment (MoCA). Occupational Medicine (Oxford, England).
2015;
65
(9)
:
764-5
.
View Article PubMed Google Scholar -
Petersen
R.C.,
Lopez
O.,
Armstrong
M.J.,
Getchius
T.S.,
Ganguli
M.,
Gloss
D.,
Practice guideline update summary: Mild cognitive impairment: Report of the Guideline Development, Dissemination, and Implementation Subcommittee of the American Academy of Neurology. Neurology.
2018;
90
(3)
:
126-35
.
View Article PubMed Google Scholar -
Chen
Y.X.,
Liang
N.,
Li
X.L.,
Yang
S.H.,
Wang
Y.P.,
Shi
N.N.,
Diagnosis and Treatment for Mild Cognitive Impairment: A Systematic Review of Clinical Practice Guidelines and Consensus Statements. Frontiers in Neurology.
2021;
12
.
View Article PubMed Google Scholar -
Ma
L.,
Depression, Anxiety, and Apathy in Mild Cognitive Impairment: current Perspectives. Frontiers in Aging Neuroscience.
2020;
12
:
9
.
View Article PubMed Google Scholar -
Tuokko
H.,
Frerichs
R.J.,
Cognitive impairment with no dementia (CIND): longitudinal studies, the findings, and the issues. The Clinical Neuropsychologist.
2000;
14
(4)
:
504-25
.
View Article PubMed Google Scholar -
Costain
R.,
Redfearn
J.W.,
Lippold
O.C.,
A controlled trial of the therapeutic effects of polarization of the brain in depressive illness. The British Journal of Psychiatry.
1964;
110
(469)
:
786-99
.
View Article PubMed Google Scholar -
Carney
M.W.,
Negative polarisation of the brain in the treatment of manic states. Irish Journal of Medical Science.
1969;
8
(3)
:
133-5
.
View Article PubMed Google Scholar -
U. Pancholi,
V. Dave,
Analysis of electric field strengths and focality for healthy and neurologically impaired subjects upon multiple tDCS stimulation protocols. Research on Biomedical Engineering.
2023;
39
(4)
:
991-1006
.
View Article Google Scholar -
Purpura
D.P.,
McMurtry
J.G.,
Intracellular activities and evoked potential changes during polarization of motor cortex. Journal of Neurophysiology.
1965;
28
(1)
:
166-85
.
View Article PubMed Google Scholar -
Pancholi
U.,
Dave
V.,
Quantification of electric field strength of tDCS in alzheimer's and mild cognitive impairment patients. Int J Adv Technol Eng Explor..
2021;
8
(82)
:
1168-82
.
View Article Google Scholar -
Pancholi
U.,
Dave
V.,
Variability of E-field in Dorsolateral Prefrontal Cortex Upon a Change in Electrode Parameters in tDCS.. International Conference on Bio Signals, Images, and Instrumentation (ICBSII).
2023;
:
1-8
.
View Article Google Scholar -
Nitsche
M.A.,
Cohen
L.G.,
Wassermann
E.M.,
Priori
A.,
Lang
N.,
Antal
A.,
Transcranial direct current stimulation: state of the art 2008. Brain Stimulation.
2008;
1
(3)
:
206-23
.
View Article PubMed Google Scholar -
Datta
A.,
Bansal
V.,
Diaz
J.,
Patel
J.,
Reato
D.,
Bikson
M.,
Gyri-precise head model of transcranial direct current stimulation: improved spatial focality using a ring electrode versus conventional rectangular pad. Brain Stimulation.
2009;
2
(4)
:
201-7
.
View Article PubMed Google Scholar -
Sharma
G.,
Chowdhury
S. Roy,
IEEE Conf Comput Intell Bioinforma Comput Biol CIBCB 2019. 2019
.
-
Morya
E.,
Monte-Silva
K.,
Bikson
M.,
Esmaeilpour
Z.,
Biazoli
C.E.,
Fonseca
A.,
Beyond the target area: an integrative view of tDCS-induced motor cortex modulation in patients and athletes. Journal of neuroengineering and rehabilitation.
2019;
16
(1)
:
1-29
.
View Article Google Scholar -
Pancholi
U.V.,
Dave
V.,
Review of computational approaches to model transcranial direct current stimulations tDCS and its effectiveness. J Integr Sci Technol..
2022;
10
(1)
:
1-10
.
-
Lefaucheur
J.P.,
André-Obadia
N.,
Antal
A.,
Ayache
S.S.,
Baeken
C.,
Benninger
D.H.,
Evidence-based guidelines on the therapeutic use of repetitive transcranial magnetic stimulation (rTMS). Clinical Neurophysiology.
2014;
125
(11)
:
2150-206
.
View Article PubMed Google Scholar -
Fu
Q.,
Cheng
Q.G.,
Kong
X.C.,
Liu
D.X.,
Guo
Y.H.,
Grinstead
J.,
Comparison of contrast-enhanced T1-weighted imaging using DANTE-SPACE, PETRA, and MPRAGE: a clinical evaluation of brain tumors at 3 Tesla. Quantitative Imaging in Medicine and Surgery.
2022;
12
(1)
:
592-607
.
View Article PubMed Google Scholar -
Habes
M.,
Sotiras
A.,
Erus
G.,
Toledo
J.B.,
Janowitz
D.,
Wolk
D.A.,
White matter lesions: spatial heterogeneity, links to risk factors, cognition, genetics, and atrophy. Neurology.
2018;
91
(10)
:
e964-75
.
View Article PubMed Google Scholar -
ADNI | Alzheimer’s Disease Neuroimaging Initiative [Internet]. [cited 2022 Nov 14]. Available from: https://adni.loni.usc.edu/.
.
-
Saturnino
G.B.,
Puonti
O.,
Nielsen
J.D.,
Antonenko
D.,
Madsen
K.H.,
Thielscher
A.,
A Comprehensive Pipeline for Individualized Electric Field Modelling for Transcranial Brain Stimulation. bioRxiv.
2018;
:
1-13
.
View Article Google Scholar -
Saturnino
G.B.,
Madsen
K.H.,
Thielscher
A.,
Efficient Electric Field Simulations for Transcranial Brain Stimulation. bioRxiv.
2019;
:
541409
.
View Article Google Scholar -
Mikkonen
M.,
Laakso
I.,
Tanaka
S.,
Hirata
A.,
Cost of focality in TDCS: interindividual variability in electric fields. Brain Stimulation.
2020;
13
(1)
:
117-24
.
View Article PubMed Google Scholar
Comments
Article Details
Volume & Issue : Vol 11 No 2 (2024)
Page No.: 6209-6223
Published on: 2024-02-29
Citations
Copyrights & License
This work is licensed under a Creative Commons Attribution 4.0 International License.
Search Panel
- HTML viewed - 3606 times
- PDF downloaded - 939 times
- XML downloaded - 104 times
