

Copyrights: R Naveen Narayan, Ameya K P, Ashikha Shirin Usman P P, Durairaj Sekar, 2024. License: This work is licensed under a Creative Commons Attribution 4.0 International License.
Abstract
Background: According to various studies, type II diabetes (T2D), a serious metabolic disease marked by insulin resistance with disrupted glucose homeostasis, affects millions of people worldwide and may reach 552 million cases by 2030. Recent studies highlighted the key role of microRNAs (miRNAs) in various cellular processes related to disease development. Moreover, studies have indicated increased concentrations of miR-9-5p in T2D individuals, thereby suggesting a possible role for miR-9-5p in influencing the regulation of glucose metabolism. Hence, the current study aims to focus on miR-9-5p and its target nuclear factor kappa B (NFkB1) in T2D by utilizing publicly available genome sequences to point out their potential as diagnostic and therapeutic biomarkers.
Methods: Twenty blood samples from ten T2D patients and ten healthy patients were taken for this investigation and stored for further analysis. This work identified miR-9-5p as a possible T2D Mellitus (T2DM) candidate by utilizing bioinformatic tools like the NCBI database, BLAST, miRbase, RNAfold, and TargetScan. Additionally, the secondary structure of miR-9-5p was constructed using RNAfold, and Ct and melt curves were used to statistically evaluate the miR-9-5p levels. The investigation also looks into the gene expression of nuclear factor kappa B (NFkB1).
Results: hsamiR- 9-5p's lowest free energy was found to be -40.20 kcal after thoroughly examining its secondary structure, suggesting its possible relevance in T2D regulation. The results indicate that T2D patients have dysregulated miR-9-5p and NFkB1 expression levels. The observed upregulation of NFkB1 and downregulation of miR-9-5p indicate the potential roles of these molecules in the onset of T2D.
Conclusion: According to our findings, miR-9-5p may be a valuable target for T2DM treatment and a diagnostic and predictive tool. Understanding miR-9-5p's function and its target gene NFkB1 may shed light on the molecular causes of T2D, paving the way for innovative therapies. Further research is imperative to fully comprehend the functional consequences of miR-9-5p dysregulation and its impact on NFkB1-mediated pathways in T2D.
Introduction
Type II diabetes (T2D) is a chronic metabolic condition characterized by insulin resistance and disrupted glucose homeostasis. Over 400 million people are affected worldwide, which could exceed 552 million by 2030, thereby posing a significant global threat1. In diabetic patients, the major risk factors for morbidity and mortality include long-term vascular complications, like coronary artery disease (CAD), myocardial infarction (MI), and stroke2. T2D is associated with microvascular and macrovascular complications, impacting the eyes and kidneys and reducing life expectancy. These complications share common underlying causes involving small vessels (e.g., capillaries) and share comparable etiological traits3, reflecting the intricate interplay between environmental and genetic factors affecting T2D progression. Additionally, studies present miRNA and nuclear factor kappa B (NFκB1) as crucial contributors in T2D development due to their altered expression levels4. The current work aims to determine miR-9-5p and NFkB1 levels and their possible roles in T2D.
Tiny non-coding RNA strands called microRNAs (miRNA) regulate post-transcriptional gene expression. They act by adhering to the 3’ untranslated region (UTR) of the target mRNA, thereby triggering its destruction or translational suppression5. Insulin signaling, pancreatic beta-cell activity, and glucose metabolism are biological processes involving miRNA. Among the aberrantly expressed miRNAs associated with T2D, miR-9-5p was demonstrated to be crucial for the onset of the disease. Previous studies indicated that T2D patients present an altered expression of miR-9-5p, associated with insulin resistance and beta-cell dysfunction6.
Research on this topic has demonstrated the critical function of the transcription factor NFκB in controlling immunological and inflammatory responses7. It indicates that NFκB controls numerous genes involved in T2D-related processes, including insulin resistance, inflammation, and oxidative damage. A crucial component of the NFκB complex, NFkB1, is involved in the pathophysiology of T2D. Studies conducted on T2D animal models during insulin-resistant stages have revealed dysregulated NFkB1 levels and expression8. However, the precise function of NFkB1 and its relationship with miR-9-5p in T2D remains poorly known.
A case-control approach was used in this work to evaluate miR-9-5p and NFkB1 expression levels in T2D patients and healthy controls. Those levels were determined by quantitative reverse transcription-polymerase chain reaction (qRT-PCR) on RNA extracted from blood samples. The qRT-PCR data was then statistically analyzed.
The findings will have significant clinical implications. Gaining knowledge about NFkB1 and miR-9-5p contribution to the onset of T2D may help shed light on the disease’s molecular causes, and these molecules might serve as potential therapeutic targets or valuable diagnostic markers. Moreover, understanding the intricate interactions between microRNA regulation and inflammatory signaling pathways in T2D may help elucidate the link between miR-9-5p and NFkB1.
This study aims to assess and outline NFkB1 and miR-9-5p expression levels in T2D patients. The outcomes could lead to developing specialized treatment approaches and enhance our understanding of the molecular pathways implicated in T2D. Ultimately, these efforts hold promise in the ongoing battle against the increasing impact of T2D and can potentially improve the lives of individuals affected worldwide.
Materials and Methods
Retrieval of T2D genomic and miRNA sequences
The human genome sequence data relevant to T2D Mellitus (T2DM) was acquired from NCBI through the International Nucleotide Sequence Database Consortium. A specific query for “genome sequence of type 2 diabetes in Homo sapiens” was used to extract pertinent genomic information for T2DM. After removing duplicate and low-quality sequences, a dedicated nucleotide database tailored to genomic sequences associated with T2DM was constructed. To complement this genomic data, miRNA annotations were sourced from miRBase (http://www.mirbase.org/), a reputable repository for miRNA information, using pre-miRNA (38,589 as of 2022) and mature miRNA (48,885 as of 2023) datasets. Subsequently, the T2DM nucleotide database was cross-referenced with the miRNA dataset to identify homologous sequences, facilitating a comprehensive exploration of potential miRNA involvement in T2DM pathogenesis9.
Identification of pre-miRNAs
The search for homologous sequences in the T2DM nucleotide database starts with the mature miRNAs. The recently established T2DM-specific sequence database was queried for homology using reference miRNA sequences. BLAST 2.2.26+ was employed for this purpose, utilizing default settings for all parameters and an e-value cutoff of 0.01. Sequences exhibiting no more than three mismatches compared to the NCBI protein database were further confirmed as non-protein encoding. Subsequently, the aligned portions of these sequences were identified and considered as potential pre-miRNA sequences, facilitating the comprehensive exploration of miRNA involvement in T2DM9.
Confirmation of potential pre-miRNA and their corresponding targets
In addition to identifying the mature miRNA sequence expressed in the T2DM genomic sequence, RNAfold was employed to validate its secondary structure. Specific conditions were assessed to ensure the validity of these structures: 1) the presence of a stem-loop hairpin configuration in the RNA structure; 2) the proper positioning of the mature miRNA within the hairpin structure on one side; 3) the number of mismatches between the miRNAs in one arm and the other is below seven; and 4) the A+U content falls within 40%–70%, accompanied by a higher negative energy in the secondary structure. Target prediction was facilitated through tools, such as TargetScan, to aid in potential target identification, thus assisting in elucidating the regulatory roles of these miRNAs in a T2DM context9.
Sample collection
The institutional ethical committee approved the study (584/03/2023/UG/SRB/SMCH), and samples were gathered in compliance with the Helsinki Declaration. After receiving informed consent from the Department of Medicine at Saveetha Medical College and Hospitals, 20 blood samples were collected, comprising ten samples from healthy individuals and ten samples from individuals diagnosed with T2DM. The sample size was calculated using Gpower. The Department of Biochemistry at Saveetha Medical College and Hospitals verified the T2DM diagnosis. After collection, the samples were centrifuged. During this process, the blood, mixed with an anticoagulant, undergoes spinning, causing the lighter plasma to form the upper layer, which is then meticulously extracted10. The extracted plasma was stored at -20 °C for subsequent analysis.
Inclusion and exclusion criteria
The study excluded participants presenting secondary issues, such as hypertension and renal failure. Only individuals aged 18 years and above, capable of providing informed consent, were eligible for enrollment.
RNA extraction and quantification
According to the instructions provided by the manufacturer, total RNA was extracted from the plasma samples using a TRIzol reagent (Invitrogen, Carlsbad, CA, USA). The RNA extract’s quality and quantity were assessed using a NanoDrop 2000 Lite (Thermo Fisher Scientific, Waltham, US) spectrophotometer. RNA samples were kept at -20 °C until further examination11.
Reverse transcription
RNA samples were mixed with nuclease-free water, 10 mM deoxyribonucleotide triphosphates (New England Biolabs Inc.), oligo (dT)18 primers (Promega, 50 μM), and a universal adapter for miRNAs. The mixture was incubated at 65 °C for five minutes. Another mixture containing the 5x prime buffer, reverse transcriptase, murine RNase inhibitor, and nuclease-free water (all from New England Biolabs Inc.) was prepared in 10 μl. This mixture was added to the 10 μl mixture containing the template RNA to bring the volume up to 20 μl. This reaction mixture was incubated in a thermal cycler (ThermoFisher MiniAmp plus) at 30 °C for 10 min, 42 °C for 30 min, 95 °C for 5 min, and 4 °C for the final cooling down. The obtained cDNA quantified by Nanodrop Lite was kept at -20 °C until further experiments (10,11). miR-9-5p and NFκB primer sequences are given below:
NFκB:
Forward: 5’ GCAGCACTACTTCTTGACCACC 3’
Reverse: 5’ TCTGCTCCTGAGCATTGACGTC 3’
miR-9-5p:
Forward: 5’ CCGGTCTTTGGTTATCTAGCTG 3’
Reverse: 5’ CTCAACTGGTGTCGTGGAGTC3 3’
qRT-PCR analysis
The previously obtained NFκB and miR-9-5p cDNAs were analyzed by qPCR using Sybr Green (Takara, Japan) as the intercalating agent. U6 for miR-9-5p and GAPDH for NFκB were utilized as housekeeping controls. The primers were bought from Origene, and Bio-Rad’s CFX96 Realtime System was used for the qPCR process, with the following steps: initial denaturation at 95°C for 30 sec, denaturation at 95°C for 5 sec and annealing for 30 sec (40 cycles), and final elongation to obtain the melt curve. Every test was run in duplicate, and target gene expression was calculated using the 2-∆∆Cq method10, 11.
Statistical analysis
The results were expressed as the mean of two independent experiments and the corresponding standard error of the mean (SEM). The groups were assessed for statistical variance using Microsoft Excel 365’s Student’s t-test program, and significance was determined at P < 0.05 (*). Student’s t-test is commonly used to determine significant differences between the means of two independent groups. Here, we compared miR-9-5p and NFkB1 expression levels between T2D patients and healthy controls. In the meantime, Tukey’s test was employed to determine statistical significance among the groups. Tukey’s test is commonly used to identify which specific groups differ from each other when more than two groups are compared. This study compared miR-9-5p and NFkB1 expression levels across multiple groups.

Results
Identification of pre-miRNA and its secondary structure
The NCBI database was utilized to access human genome sequences relevant to T2DM, while miRBase was employed to retrieve pre-miRNA sequences associated with the disease. Following sequence collection, researchers thoroughly analyzed the secondary structure of T2DM genomic sequences to identify potential miRNA-encoding regions. Utilizing tools such as RNAfold, they predicted the presence of miRNA-like structures within the genomic sequences, ultimately identifying the mature sequence of hsa-miR-9-5p. This miRNA, with a calculated minimal free energy of 40.20 kcal, was implicated in T2DM (Figure 1). Through a combination of sequence analysis and structural prediction, this study exemplifies the integration of bioinformatics tools in uncovering potential miRNA regulators of diseases like T2DM, offering insights into underlying molecular mechanisms and potential therapeutic targets.
Target identification
A scan was conducted using TargetScan to identify the miRNA targets and revealed that miR-9-5p targets several other significant transcripts, including NFκB1, F-box protein 28, Collagen type 4 alpha 2, and dopamine receptor D2. The target genes of has-miR-9-5p are presented in Table 3, along with their biological process and molecular role.
RNA extraction and quantification
The blood collected from healthy individuals and T2DM patients was centrifuged to separate the plasma (supernatant) from the denser blood cells and platelets (pellet). The plasma was carefully removed using a pipette without disturbing the lower layers and was transferred into clean tubes and stored appropriately for further analysis. A TRIzol reagent (Invitrogen, Carlsbad, CA, USA) was used according to the manufacturer’s instructions to isolate RNA from plasma samples. TRIzol is a widely used RNA extraction reagent and effectively isolates RNA from various sources, including plasma. It ensures the extraction of high-quality RNA from plasma samples for downstream molecular analyses. The quality and quantity of the isolated RNA were assessed using a NanoDrop 2000 Lite spectrophotometer (Thermo Fisher Scientific, Waltham, US). RNA samples were stored at -20 °C until further analysis.


| S.No | Structure | Sequence |
|---|---|---|
| 1 | Stem-loop | CGGGGUUGGUUGUUAUCUUUGGUUAUCUAG CUGUAUGAGUGGUGUGGAGUCUUCAUAAA GCUAGAUAACCGAAAGUAAAAAUAACCCCA |
| 2 | Mature miRNA | UCUUUGGUUAUCUAGCUGUAUGA |
| Source miRNA | Source organism | Pre-miRNA length | Minimum Free Energy | Mature Sequence | Match Extent | Strand | A+U% |
|---|---|---|---|---|---|---|---|
| miR-9-5p | Homo sapiens | 89 | - 40.20 kcal | UCUUUGGUUAUCUA GCUGUAUGA | 23/23 | 5p | 59.55 |
| S.no | Target Protein | Molecular function | Biological process |
|---|---|---|---|
| 1 | Nuclear Factor Kappa light polypeptide gene enhancer in B cells 1 | Proinflammatory gene expression | Innate immune memory response |
| 2 | Dopamine receptor D2 | Dopamine release | Neurotransmitter |
| 3 | Homeobox B1 | Induce cell fate | Tumour suppressor |
| 4 | F-Box protein 28 | Substrate recognition | Protein-protein interaction |
| 5 | Translin associated factor-X | Binding of translin | Cytoplasmic protein |
miR-9-5p and NFκB gene expression analysis
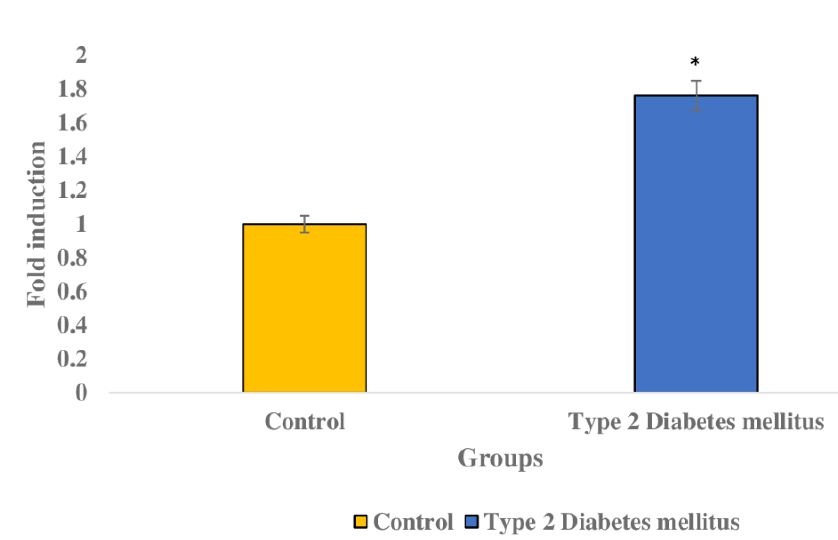
The qRT-PCR analysis allowed us to compare miR-9-5p and NFκB1 levels between T2DM and healthy patients’ blood samples. T2DM patients displayed significantly lower miR-9-5p levels than healthy patients, while their NFκB1 levels were significantly higher (Figure 2 and Figure 3). Thus, further studies could validate the role of these genes in T2DM. The inverse correlation illustrated in Figure 4, wherein elevated NFκB1 levels coincide with reduced miR-9-5p levels in T2DM patients, implies a negative relationship indicating a systematic association between the two, where alterations in one correspond to opposing changes in the other. Student’s t-test and Tukey’s test allowed us to effectively assess differences in gene expression levels between the two groups and identify significant variations among multiple groups, contributing to a comprehensive understanding of the molecular mechanisms involved in T2D.
Discussion
Previous studies established a link between miRNAs and T2D. Several miRNAs are connected with specific diabetic complications, such as nephropathy, neuropathy, and retinopathy12. The NFkB1 gene’s function in the development of T2D has already been extensively investigated. Previous studies revealed that the adipose tissue of T2D patients had considerably higher NFkB1 expression levels than non-diabetic patients. The higher level of NFkB1 expression may be a factor in the constant low-grade inflammation and insulin resistance observed in T2D patients13. Our study demonstrated NFκB elevations in T2DM, indicating the inflammation level.
MiR-9-5p has several functions and activates or regulates many signaling pathways. Previous studies have demonstrated that it regulates other genes in patients with metabolic syndrome and activates reverse cholesterol transport, thus paving the way for many cardiovascular diseases, like atherosclerosis14. Several studies have indicated that the NFkB1 gene regulates immune and inflammation processes. This gene is vividly associated with cancer expression as its aberrant activity is pro-tumorigenic and pro-inflammatory. Lung, liver, gastric, colorectal, thyroid, oesophageal, prostate, ovarian, and cervical carcinoma are all associated with NFκB1 signaling pathways and are usually regulated by the NFkB1 gene15.
Our research provides significant details regarding the potential functions of miR-9-5p and NFkB1 in the development of T2D. By examining their expression levels, this study aimed to determine how miR-9-5p and the NFkB1 gene play a role in T2D, combining quantitative and computational bioinformatics techniques. MiR-9-5p and NFkB1 expression levels were compared between T2D patients and healthy controls samples. The results indicated a considerable miR-9-5p downregulation and a significant NFkB1 upregulation, indicating an inverse relationship. Gaining this knowledge provides valuable insights into the complex molecular dynamics linked to T2DM and could hold significance for diagnostic or therapeutic strategies aimed at these molecular elements.
Our study did not investigate the functions or associations of these molecules; instead, it focused exclusively on their expression levels. More research must be done to fully understand how miR-9-5p and NFkB1 regulate the onset and progression of T2D. Moreover, the study sample size was relatively small; larger and greater varying populations should be used to confirm the results. Hence, more investigations are required to gain a greater knowledge of T2D and its link with miR-9-5p and the NFkB1 gene.
Conclusion
In summary, this study centers on assessing the expression levels of miR-9-5p and NFkB1 in individuals with T2D, comparing these values statistically to those of a group of healthy individuals. Ultimately, a deeper comprehension of these molecular components may pave the way for the discovery of innovative pharmaceutical strategies and improved treatment options for this prevalent metabolic disorder, aiming to alleviate the suffering of patients afflicted with diabetic complications and ultimately reduce morbidity and mortality.
Abbreviations
BLAST: Basic Local Alignment Search Tool, CAD: Coronary Artery Disease, GAPDH: Glyceraldehyde-3-Phosphate Dehydrogenase, MI: Myocardial Infarction, miRNA: microRNA, NCBI: National Center for Biotechnology Information, NFkB1: Nuclear Factor kappa B subunit 1, NFκB: Nuclear Factor kappa B, qRT-PCR: Quantitative Reverse Transcription Polymerase Chain Reaction, RNA: Ribonucleic Acid, SEM: Standard Error of the Mean, T2D: Type 2 diabetes, UTR: Untranslated Region
Acknowledgments
Sekar D is a recipient of the Extramural Grants (2019-0106/CMB/ ADHOC/BMS and 5/4/8-18/CD/2021-NCD-II), Indian Council of Medical Research (ICMR), Government of India, and their support is duly acknowledged.
Author’s contributions
Formal analysis, D.S; writing - original draft preparation, R.N; writing – review; A.P; writing- editing; A.P. All authors read and approved the final manuscript.
Funding
None.
Availability of data and materials
Data and materials used and/or analyzed during the current study are available from the corresponding author on reasonable request.
Ethics approval and consent to participate
Not applicable.
Consent for publication
Not applicable.
Competing interests
The authors declare that they have no competing interests.
References
-
Whiting
D.R.,
Guariguata
L.,
Weil
C.,
Shaw
J.,
IDF diabetes atlas: global estimates of the prevalence of diabetes for 2011 and 2030. Diabetes Research and Clinical Practice.
2011;
94
(3)
:
311-21
.
View Article PubMed Google Scholar -
Cole
J.B.,
Florez
J.C.,
Genetics of diabetes mellitus and diabetes complications. Nature Reviews. Nephrology.
2020;
16
(7)
:
377-90
.
View Article PubMed Google Scholar -
Cade
W.T.,
Diabetes-related microvascular and macrovascular diseases in the physical therapy setting. Physical Therapy.
2008;
88
(11)
:
1322-35
.
View Article PubMed Google Scholar -
Raza
W.,
Guo
J.,
Qadir
M.I.,
Bai
B.,
Muhammad
S.A.,
qPCR Analysis Reveals Association of Differential Expression of SRR, NFKB1, and PDE4B Genes With Type 2 Diabetes Mellitus. Frontiers in Endocrinology (Lausanne).
2022;
12
.
View Article PubMed Google Scholar -
Hill
M.,
Tran
N.,
miRNA interplay: mechanisms and consequences in cancer. Disease Models & Mechanisms.
2021;
14
(4)
.
View Article PubMed Google Scholar -
Saisho
Y.,
β-cell dysfunction: its critical role in prevention and management of type 2 diabetes. World Journal of Diabetes.
2015;
6
(1)
:
109-24
.
View Article PubMed Google Scholar -
Jardin
F.,
NFkB Pathway and Hodgkin Lymphoma. Biomedicines.
2022;
10
(9)
:
2153
.
View Article PubMed Google Scholar -
Choi
H.J.,
Hwang
S.,
Lee
S.H.,
Lee
Y.R.,
Shin
J.,
Park
K.S.,
Genome-wide identification of palmitate-regulated immediate early genes and target genes in pancreatic beta-cells reveals a central role of NF-κB. Molecular Biology Reports.
2012;
39
(6)
:
6781-9
.
View Article PubMed Google Scholar -
Saravanan
S.,
Islam
V.I.,
Thirugnanasambantham
K.,
Sekar
D.,
In Silico Identification of Human miR 3654 and its Targets Revealed its Involvement in Prostate Cancer Progression. MicroRNA (Shariqah, United Arab Emirates).
2016;
5
(2)
:
140-5
.
View Article PubMed Google Scholar -
Krishnan
R.,
Mani
P.,
Sivakumar
P.,
Gopinath
V.,
Sekar
D.,
Expression and methylation of circulating microRNA-510 in essential hypertension. Hypertension Research.
2017;
40
(4)
:
361-3
.
View Article PubMed Google Scholar -
Rajkumar
K.V.,
Lakshmanan
G.,
Sekar
D.,
Identification of miR-802-5p and its involvement in type 2 diabetes mellitus. World Journal of Diabetes.
2020;
11
(12)
:
567-71
.
View Article PubMed Google Scholar -
Massaro
J.D.,
Polli
C.D.,
Costa E Silva
M.,
Alves
C.C.,
Passos
G.A.,
Sakamoto-Hojo
E.T.,
Post-transcriptional markers associated with clinical complications in Type 1 and Type 2 diabetes mellitus. Molecular and Cellular Endocrinology.
2019;
490
:
1-14
.
View Article PubMed Google Scholar -
Cao
Y.,
Han
X.,
Wang
Z.,
Liu
Y.,
Wang
Y.,
Zhang
R.,
TLR4 knockout ameliorates streptozotocin-induced osteoporosis in a mouse model of diabetes. Biochemical and Biophysical Research Communications.
2021;
546
:
185-91
.
View Article PubMed Google Scholar -
D'Amore
S.,
Härdfeldt
J.,
Cariello
M.,
Graziano
G.,
Copetti
M.,
Di Tullio
G.,
Identification of miR-9-5p as direct regulator of ABCA1 and HDL-driven reverse cholesterol transport in circulating CD14+ cells of patients with metabolic syndrome. Cardiovascular Research.
2018;
114
(8)
:
1154-64
.
View Article PubMed Google Scholar -
Concetti
J.,
Wilson
C.L.,
NFKB1 and Cancer: friend or Foe?. Cells.
2018;
7
(9)
:
133
.
View Article PubMed Google Scholar
Comments
Article Details
Volume & Issue : Vol 11 No 2 (2024)
Page No.: 6183-6190
Published on: 2024-02-29
Citations
Copyrights & License
This work is licensed under a Creative Commons Attribution 4.0 International License.
Search Panel
Pubmed
Google Scholar
Pubmed
Google Scholar
Pubmed
Google Scholar
Pubmed
Search for this article in:
Google Scholar
Researchgate
- HTML viewed - 3384 times
- PDF downloaded - 1126 times
- XML downloaded - 101 times
