

Copyrights: Sergiy Lozinsky, Illia Taran, Maryna Lozynska, 2024. License: This work is licensed under a Creative Commons Attribution 4.0 International License.
Abstract
This article reviews some existing approaches to the interpretation of standard ECG with T-wave abnormalities present. It emphasizes the role of the localization of T-wave abnormalities, as well as the analysis of the direction and magnitude of QRS, T, and QRS-T mean vectors, taking other concomitant ECG deviations and additional clinical data into account. The use of the implemented approaches is illustrated using corresponding clinical cases. Despite considerable progress in myocardial visualization, ECG interpretation remains a basic skill for any cardiologist because of ECG's availability and ease of use in patients regardless of their physical or mental status. The meaning of changes in the final part of the ventricular complex, including T-wave abnormalities, is one of the most debatable and controversial subjects within ECG analysis since they depend on many precursors such as coronary flow, myocardial thickness, and potassium or other electrolyte imbalance. The purpose of this publication is to analyze the currently available methods for interpreting T-wave abnormalities (TWAs) and find the optimal approach to interpreting such abnormalities.
Introduction
The vast majority of healthy adults have a positive orientation of the T wave in almost all leads. The exception is lead V1, where the T wave is usually negative. T inversion is also common in the III and avF leads. Such patterns seem self-evident for those who are familiar with ECG; however, few have a clue about the cause of the difference between the well-known ventricular cardiomyocyte action potential curve and ECG of the ventricular complex (Figure 1).


To explain this paradox, the founders of electrocardiography proposed a theory that the reason for the difference lies in the summation of the action potentials (APs) of the subendocardial and subepicardial myocardial layers1, 2.
It is known that despite the earlier onset of depolarization of the subendocardial layer of the ventricular myocardium, its repolarization lasts longer (Figure 2). According to the theory of Robert Grant, the reason for the slower repolarization of the subendocardial layer is a greater mechanical compression at the end of the systole than that of the subepicardial layer3. In their striking study, Waymore et al. demonstrated that the Ca2+-independent portion of transient outward K+ current (Ito) exhibited a transmural gradient in the ventricle, and recovery from inactivation was >10-fold slower in the endocardium than in the epicardium4. Either way, this difference in the de- and repolarization time of myocardial layers causes the appearance of numerous variations in ECG waves, in particular, the T wave. Frank N. Wilson first described the electrophysiological heterogeneity of the myocardium. He also proposed the interpretation of changes and called this phenomenon the ventricular gradient, later known as the “ventricular gradient of Wilson.” Now, the acronym “QRS-T” rather than “ventricular gradient” is used more frequently, especially when indicating only the direction of this vector or the value of the angle between the QRS and T mean vectors. Since the ventricular gradient is closely related to the AP of ventricular cardiomyocytes, it has a vector expression and is represented by a mean vector with a certain direction and magnitude in the frontal and other planes, similar to the mean electrical axis of the heart. The ventricular gradient is determined by the interaction of de- and repolarization processes, and therefore, changes in the final part of the ventricular complex reflect changes in the ventricular gradient. Therefore, it seems essential to analyze TWAs through changes in the ventricular gradient (QRS-T).
T-wave inversion (TWI) usually refers to a negative T wave with an amplitude of more than 1 mm in any leads except avR, III, aVF, and V1. Accordingly, a decrease in the T amplitude can be considered a steady decrease of more than 1 mm during dynamic observation.
Primary and secondary TWAs
The categorization of TWAs (including TWI) as primary and secondary may be useful for determining their causes. Primary TWAs are associated with changes in the myocardium itself, such as edema, fibrosis, and metabolic or electrolyte imbalance. Secondary ones are determined by a change in the normal direction of de- and repolarization processes, which occurs in myocardial hypertrophy, bundle branch blocks, and pre-excitation syndromes. In these conditions, the QRS-T vector remains normally directed but is shortened since the QRS and T vectors have almost opposite directions. On the contrary, substantial deviations in the direction of the QRS-T vector are usually associated with primary myocardial impairment. In this case, both the direction and magnitude of the mean QRS-T axis change. Thus, if changes in the T wave are associated with changes in the direction and sometimes the magnitude of the QRS- T, they indicate primary, organic changes in the myocardium.
Concomitant ECG changes
Changes in the T wave may be isolated or associated with changes in other ECG components, such as the ST segment, QRS amplitude, and QTc duration. As mentioned above, secondary TWAs are always associated with changes in other ECG parameters. However, sometimes, these changes are not easy to detect. In some patients, secondary changes may be combined with primary changes. In addition, population-based studies have shown that 0.5 to 2% of healthy individuals may have T-wave changes. Thus, interpreting T-wave changes in certain cases is a difficult task with many unknowns.
| Lead | I | avF | Angle (º) | Mean magnitude |
|---|---|---|---|---|
| QRS | 80 | 29 | 20 | 85 |
| T | 0 | 12 | 90 | 12 |
| QRS-T | 80 | 41 | 27 | 90 |
| Lead | I | avF | Angle (º) | Mean magnitude |
|---|---|---|---|---|
| QRS | 9 | 17 | 54 | 25 |
| T | 9 | -31 | -70 | 36 |
| QRS-T | 0 | -14 | -35 | 30 |
Localization of TWAs
Using a standard 12-lead ECG, an anterior, lateral, inferior, and diffuse TWA can be identified5. An anterior TWA is defined in leads V1–V4. As noted above, a negative T in V1 is considered normal. The spreading of the negative T wave beyond V1, in the V2–V4 leads occurs very often in children and adolescents (<14 years) and is usually considered normal. Such findings may be explained by the relative enlargement of the right ventricle in newborns and children. Brosnan et al., using cardiac magnetic resonance, showed that this ECG pattern may reflect a lateral displacement of the right ventricle rather than a true right ventricular dilatation6. TWI in V2 and even V3, despite the absence of the right bundle branch block, may also be found in some healthy young adults, especially women and non-white persons, as a persistent juvenile pattern. The ECG archive and the absence of complaints could be a clue to this riddle. Conversely, an anterior TWA may be a symptom of a serious cardiac disease like arrhythmogenic cardiomyopathy (AC) or hypertrophic cardiomyopathy (HCMP). Unfortunately, isolated anterior TWAs seem unable to discriminate between innocent ECG deviations and organic pathology7, 8. However, some other ECG findings may indicate cardiovascular disease. For example, Wellens syndrome, which is characterized by biphasic or deep inversion of the T wave in V1–3 leads and chest pain, may be diagnostic for left descending artery obstruction. The epsilon wave that follows the QRS complex also helps to decide in favor of CVD such as AC or CAD, while TWI in V1–3 combined with coved ST segment elevation is indicative of Brugada syndrome.
A lateral TWA may be defined as an abnormality revealed in leads I and AVL, V5, and/or V6. Unlike an anterior TWA, this abnormality is not connected with puberty or a variety of spatial positions of the heart. Accordingly, a lateral TWA is always suspicious concerning CVDs. It very often occurs in cases of left ventricular hypertrophy and left bundle branch block. When someone meets the definite criteria for these conditions, the explanation of the TWA seems to be easy. More complicated cases may include additional (primary) abnormalities such as myocardial ischemia, inflammation, or fibrosis that may be masked by secondary changes. We believe that vector analysis using ventricular gradient may be helpful in discriminating primary myocardial changes. As an illustration, we present the case of a 55-year-old female patient with grade 1 arterial hypertension. Her ECG with a lateral TWA is shown in Figure 3.
Pre-excitation of ventricles and amplitude criteria for LVH based on the Sokolow–Lyon (Rv5+Sv2=46mm) and Cornell criteria for women (RavL+Sv3=26mm) may be noted in her ECG. Echocardiography confirmed the presence of LVH (LVMI=125g/m2). The mean QRS axis is about 20º, while the mean T axis is about 90º. The magnitude of the QRS-T vector can be calculated using the rule of the parallelogram of forces, where the magnitude of the force acting in the definite lead is equal to the area under the curve (AUC), expressed in mV*s. If 10 mm of amplitude is equal to 10 mV, then 5 mm (one cell of ECG paper) is equal to 5 mV. Accordingly, if the tape speed is 25 mm/s, then 1 cell equals 0.2 s. Thus, 1 cell represents 0.1 mV*s (or 100 µVs), and 1 little cell (1 mm2) = 4 µVs. After calculating the AUC for QRS and T in perpendicular leads (leads I and avF), we get the values summarized in Table 1.
In lead I, the total area of QRS is under the isoline and is equal to 80 µVs. The area of the T wave is divided by the isoline into 2 approximately equal parts, namely under and above this line, and the sum of these parts is close to 0 µVs. In lead avF, the area of QRS is mostly positive, and the sum of the positive and negative parts of QRS is 29 µVs. Knowing that the angle of the mean QRS axis is 20º, it is easy to calculate the magnitude of the mean QRS, T, and QRS-T vectors using the rules of trigonometry.
Another abnormal finding in this ECG was prolonged QT. Using the correction formula of Fridericia, the calculated value seemed to be abnormal (478 ms). However, in the presence of a complete left bundle branch block, it is better to use a specified equation for such a condition. One such was developed by Wang et al.: QTc=QTdur-(0.86×QRSdur-71)9. When we used this formula for QT=455 ms and QRS duration=146 ms, the calculated QTc value was 400 ms, which is normal. Thus, this TWA may be interpreted as a benign secondary deviation due to LVH and LBBB.
Inferior TWA is consistent with changes in the T wave in II and avF. Such deviations may sometimes be encountered in pathological conditions like mitral valve prolapse and AC but often may be found in healthy subjects. Accordingly, the significance of an isolated inferior TWA is still uncertain. The inferior TWA is often combined with another location, and in this case, the prognosis is more serious.
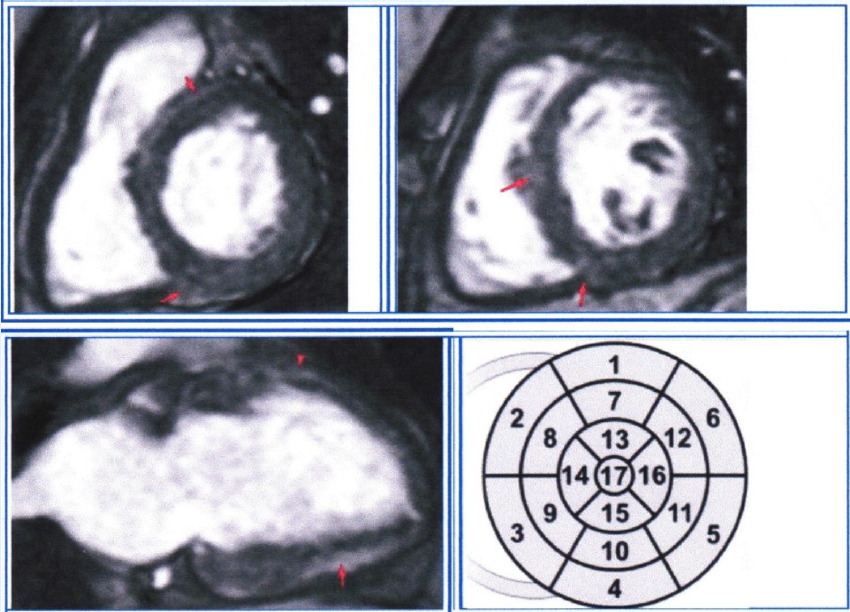
Figure 5 demonstrates an ECG with an inferolateral TWA of a 43-year-old female patient. She had a history of closed cranial trauma 25 years ago and a recent lacunar stroke (3 weeks ago). She also had occasional arterial hypertension. During the heart ultrasound, no myocardial or valvular abnormalities were found, but by using MRI with late gadolinium enhancement, multiple spots of myocardial fibrosis were found in segments 2, 3, 4, 5, 8, 10, 11, and 12, which were consistent with the history of myocarditis (Figure 6).
Since the ECG in Figure 5 was recorded at a speed of 50 mm/s, then 1 mm2=1µVs. The main parameters of the ventricular complex, calculated similarly to the previous case, are presented in Table 2.
The calculations showed a substantial deviation of the T wave mean axis (−70º) that finally led to the pathological (less than 0º) direction of the QRS-T mean axis (−35º) and very wide (124º) angle between mean QRS and mean T axis (more than 110º). No other findings potentially responsible for TWA (LVH, BBB) were encountered during ECG interpretation. A few disorders of right ventricle conduction, which manifest as specific rSr deformations in V1–V2 without substantial conduction delay (duration of QRS is 95 ms), cannot explain the genesis of a TWA. Thus, this inferolateral TWA indicates primary myocardial impairment (multiple fibrosis), which was confirmed by MRI. Other investigators described similar TWAs due to myocardial edema10, meaning that a TWA is a non-specific but important ECG finding.
Sometimes, TWAs may have diffuse (“global”) spread. Notably, most patients with this characteristic are women. Walder and Spodic, who identified 100 cases among more than 30,000 interpreted ECGs with TWI, reported a distribution of 82 women and 18 men despite the study including an equal number of male and female participants11. Moreover, they described a significantly more vertical QRS and QRS-T mean axis in women (p = 0.034 and p = 0.016, respectively). The next ECG may be illustrative (Figure 7).
This 51-year-old woman had complaints of short-term tachycardia episodes. In her archival ECG, completed 2 years ago, no TWA was found. No clinically significant findings were noted during EchoCG. Analyzing the ECG in Figure 7, it is easy to note that the QRS mean vector is directed normally (about 60º) and the T mean vector direction is close to 0º, so the angle between QRS and T is about 30º, which is normal (less than 130º12). Accordingly, the QRS-T mean vector will be within the normal range (0 ± 90º), and its magnitude will be greater than that of the QRS vector. Thus, normal QRS-T indicates the absence of primary myocardial changes. Moreover, there was no additional evident myocardial impairment such as changes in the QTc duration, enlargement of heart chambers, and conduction disorders. This explains why the TWA in this patient has a relatively benign character.
The significant variance of the T-wave amplitude during her daily ECG monitoring also confirmed the innocent nature of this TWA. It may be characterized as a rapidly reversible TWA dependent on potassium current or adrenergic imbalance, which are common in women around menopausal age. The literature also supported the opinion that the global TWA itself was not a poor prognostic indicator11.
Unlike the last case, most ECGs with TWAs are markers of substantially increasing CV risk. The risk of SCD was shown to be threefold higher in patients with TWI in leads other than V1–3 than in the general population13. In another study, the risk of SCD in patients with a TWA and QRS-T angle >67º was twofold higher14.
Yu et al. demonstrated that angiotensin II may dramatically change the electrophysiology of ventricle cardiomyocytes. Incubation of epicardial myocytes with angiotensin II for 2 to 52 hours altered Ito to resemble an unincubated endocardium4. Since the appearance of a T wave is a product of the interaction of subendo- and subepicardial layers, such modulation may be responsible for TWAs in some patients with elevated angiotensin II levels. In turn, angiotensin receptor antagonists may prevent TWAs in such patients.
Conclusion
Given the high predictive significance of the TWA for cardiovascular risk, it should be considered an important clinical symptom and a key to diagnosis rather than a diagnostic riddle. Localization of TWAs, vector analysis of QRS- T, concomitant ECG changes, and clinical data such as sex, age, and the presence of CVD may improve TWA interpretation. Although all the above mentioned calculations may be completed manually, computer software may substantially simplify TWA interpretation.
Abbreviations
None.
Acknowledgments
None.
Author’s contributions
All authors significantly contributed to this work. All authors read and approved the final version of the article.
Funding
None.
Availability of data and materials
Not applicable.
Ethics approval and consent to participate
Not applicable.
Consent for publication
Not applicable.
Competing interests
The authors declare that they have no competing interests.
References
-
Gardberg
M.,
Rosen
I.L.,
The ventricular gradient of Wilson. Annals of the New York Academy of Sciences.
1957;
65
(6)
:
873-93
.
View Article PubMed Google Scholar -
Wilson
F.,
Macleod
A.,
Barker
P.,
Johnston
F.,
The Determination and the Significance of the Areas of the Ventricular Deflection of the Electrocardiogram. American Heart Journal.
1934;
10
(1)
:
46-61
.
View Article Google Scholar -
Hurst
J.W.,
Thoughts about the ventricular gradient and its current clinical use (Part I of II). Clinical Cardiology.
2005;
28
(4)
:
175-80
.
View Article PubMed Google Scholar -
Yu
H.,
Gao
J.,
Wang
H.,
Wymore
R.,
Steinberg
S.,
McKinnon
D.,
Effects of the renin-angiotensin system on the current I(to) in epicardial and endocardial ventricular myocytes from the canine heart. Circulation Research.
2000;
86
(10)
:
1062-8
.
View Article PubMed Google Scholar -
D'Ascenzi
F.,
Anselmi
F.,
Adami
P.E.,
Pelliccia
A.,
Interpretation of T-wave inversion in physiological and pathological conditions: current state and future perspectives. Clinical Cardiology.
2020;
43
(8)
:
827-33
.
View Article PubMed Google Scholar -
Brosnan
M.,
La Gerche
A.,
Kalman
J.,
Lo
W.,
Fallon
K.,
MacIsaac
A.,
Comparison of frequency of significant electrocardiographic abnormalities in endurance versus nonendurance athletes. The American Journal of Cardiology.
2014;
113
(9)
:
1567-73
.
View Article PubMed Google Scholar -
Zaidi
A.,
Sheikh
N.,
Jongman
J.K.,
Gati
S.,
Panoulas
V.F.,
Carr-White
G.,
Clinical differentiation between physiological remodeling and arrhythmogenic right ventricular cardiomyopathy in athletes with marked electrocardiographic repolarization anomalies. Journal of the American College of Cardiology.
2015;
65
(25)
:
2702-11
.
View Article PubMed Google Scholar -
Sharma
S.,
Drezner
J.A.,
Baggish
A.,
Papadakis
M.,
Wilson
M.G.,
Prutkin
J.M.,
International recommendations for electrocardiographic interpretation in athletes. Journal of the American College of Cardiology.
2017;
69
(8)
:
1057-75
.
View Article PubMed Google Scholar -
Wang
B.,
Zhang
L.I.,
Cong
P.,
Chu
H.,
Liu
Y.,
Liu
J.,
A New Formula for Estimating the True QT Interval in Left Bundle Branch Block. Journal of Cardiovascular Electrophysiology.
2017;
28
(6)
:
684-9
.
View Article PubMed Google Scholar -
Cardona
A.,
Zareba
K.M.,
Nagaraja
H.N.,
Schaal
S.F.,
Simonetti
O.P.,
Ambrosio
G.,
T-Wave Abnormality as Electrocardiographic Signature of Myocardial Edema in Non-ST-Elevation Acute Coronary Syndromes. Journal of the American Heart Association.
2018;
7
(3)
:
e007118
.
View Article PubMed Google Scholar -
Walder
L.A.,
Spodick
D.H.,
Global T wave inversion. Journal of the American College of Cardiology.
1991;
17
(7)
:
1479-85
.
View Article PubMed Google Scholar -
Hurst
J.W.,
Thoughts about the ventricular gradient and its current clinical use (part II of II). Clinical Cardiology.
2005;
28
(5)
:
219-24
.
View Article PubMed Google Scholar -
Aro
A.L.,
Anttonen
O.,
Tikkanen
J.T.,
Junttila
M.J.,
Kerola
T.,
Rissanen
H.A.,
Prevalence and prognostic significance of T-wave inversions in right precordial leads of a 12-lead electrocardiogram in the middle-aged subjects. Circulation.
2012;
125
(21)
:
2572-7
.
View Article PubMed Google Scholar -
Laukkanen
J.A.,
Di Angelantonio
E.,
Khan
H.,
Kurl
S.,
Ronkainen
K.,
Rautaharju
P.,
T-wave inversion, QRS duration, and QRS/T angle as electrocardiographic predictors of the risk for sudden cardiac death. The American Journal of Cardiology.
2014;
113
(7)
:
1178-83
.
View Article PubMed Google Scholar
Comments
Article Details
Volume & Issue : Vol 10 No 12 (2023)
Page No.: 6118-6124
Published on: 2023-12-31
Citations
Copyrights & License
This work is licensed under a Creative Commons Attribution 4.0 International License.
Search Panel
Pubmed
Google Scholar
Pubmed
Google Scholar
Pubmed
Search for this article in:
Google Scholar
Researchgate
- HTML viewed - 3429 times
- PDF downloaded - 1044 times
- XML downloaded - 111 times
