

Copyrights: Lamia Bouafif, 2023. License: This work is licensed under a Creative Commons Attribution 4.0 International License.
Abstract
Background: In medicine, general anesthesia during surgery involves the administration of pharmacological (hypnotic) agents and clinical monitoring via the analysis of the patient's nervous systems (loss of consciousness and reactivity) during stimulation. Unfortunately, this clinical monitoring is complicated by factors such as curarization, shock, and drugs that block cardiovascular responsiveness. Additionally, inadequate anesthesia due to over- or underdosing increases morbidity rates, such as hypotension and respiratory depression in the case of overdose, and memorization, movement, hypertension, tachycardia, laryngospasm, and bronchospasm in the case of underdosing. Several anesthesia monitoring tools have been introduced to address this issue, such as bispectral analysis (BIS), auditory evoked potential (AEP), q-CON, and entropy monitors; however, these instruments are complicated by accuracy, noise, artifacts, and their correlation with hypnotics.
Methods: Noninvasive anesthesia monitoring methods include lower esophageal sphincter, AEP, entropy, and spontaneous electroencephalography (EEG), which is the most commonly used. This method involves BIS of the collected EEG signals and correlates well with consciousness and sedation scores regardless of the anesthetic agents used. In this paper, we present a noninvasive method for monitoring the depth of anesthesia during surgery using the AEP and BIS methods. This study aimed to reduce artifacts, optimize the hypnotics/analgesics dosage, limit the effects of pharmacological use, and ensure a better quality recovery.
Results: We applied two techniques, BIS and event-related potential (ERP), following multiple stimuli to determine the best anesthesia monitoring approach. A comparative study of the EEG signals showed that measuring cortical responses by ERP provided more precise data in space and time regarding the sedation state of the patient and better monitoring of the hypnotic dose. The BIS method was simpler and easier to implement; however, only average and static values regarding the sleep rate could be obtained.
Conclusion: BIS and ERP appear suitable for monitoring sedation and hypnotic dosage during anesthesia, with the best reliability rates and speed with a latency of < 4 ms and an accuracy of 92%.
Introduction
Electroencephalography (EEG) is a technique that records brainstem activity through the cortex and may involve cortical recordings in some cases. EEG measures spontaneous activity in the presence or absence of a stimulus. For example, the auditory evoked response (AER) results from an auditory stimulus. The event-related potential (ERP) is used to describe the neural responses to a specific motor, cognitive, or sensory stimulus. In the 1970s, Schmidt & Al1 introduced the clinical use of electrocochleography to diagnose Meniere’s disease using a set of electrodes placed on the exposed brain surface. Then, in 1971, Jewett and Williston conducted the first systematic study of human auditory brainstem responses2. Later, Salters and Brakman in 1976 introduced brainstem electrical response audiometry (BEA) for detecting tumor acoustics3. Cortical responses demonstrate several shapes and types, such as cortical auditory evoked potential (CAEP), long-latency or late-latency response (LLR), and auditory late response (ALR). The auditory steady state response (ASSR) was introduced in 2001, which allows the simultaneous presentation of multiple carrier frequencies in both ears and was adopted in clinical practice to estimate the hearing threshold4.
Our work focuses on two clinical applications of ERP responses: the monitoring and evaluation of cochlear prostheses by electroacoustic stimulation and the monitoring and control of anesthesia by cortical responses to stimuli. This study relates to the second application. The principle of general anesthesia is to temporarily block perception, consciousness, and motor responsiveness to stimuli, and the anesthesiologist maintains the stability of the unconscious patient’s vital functions. However, these goals (sleep and no reactivity) are distinct and can be achieved independently. Sleep is linked to hypnotic agents, while loss of reactivity is highly dependent on analgesic agents. Thus, pharmacological administration must be optimized, monitored, and adapted on a case-by-case basis throughout anesthesia. Clinical monitoring involves analyzing neural responses to stimulation, such as brain reactions to surgical incisions5. At the beginning of the last century, Guedel introduced anesthesia monitoring by describing four stages of sleep achieved with ether-chloroform (Guedel, 1920). In 1929, EEG was invented by Berger to study brain electrical activities by measuring electrical potentials6. Since 1990, the statistical and spectral analysis of signals from electroencephalograms (EEGs) has allowed the practical and clinical development of several anesthesia monitors.
In 1993, Kissin proposed a conceptual study and framework of anesthesia centered on the pharmacological effects of anesthetic drugs. Analysis of frontal cortical EEG has been shown to be beneficial in exploring the loss of consciousness component, while monitoring the electrical activity of subcortical structures allows an estimation of the patient's responsiveness to a noxious stimulus7. Among the most developed analyses involving EEG were performed by Ballard in 1997, who decomposed the input signal into a frequency spectrum by Fourier series. However, the bispectral analysis of EEG has captured the attention of the anesthetic community. The EEG bispectral index (BIS) is a statistical index derived from the EEG by an algorithm using a large patient database. This index is predictive of the depth of hypnosis induced by propofol8.
The use of depth of anesthesia monitoring in practice was introduced in 2006 following recommendations from the American Society of Anesthesiologists (ASA), followed by a Cochrane Library meta-analysis in 2007 and formal recommendations from French Society of Anesthesia & Intensive Care Medicine experts in 20099. Two major studies were conducted by Dwong, Liu, and Punjasawa. The first included 1,380 patients from 11 outpatient surgery studies. A reduction in hypnotic drug consumption of 19% was recorded. The second included 4,056 patients from 20 studies7. However, despite the development of BIS monitors, several factors limit their accuracy, resulting in an average accuracy of 70% to 80%. To solve these problems, we developed a noninvasive BIS monitor to monitor and control the anesthesia process. First, we replaced analog circuitry with programmable and embedded algorithms implemented in the Raspberry Pi electronic board. This approach prevents inaccuracies in the device's circuitry and reduces the influence of artifacts. Second, we estimated the optimal hypnotic ratio to achieve the desired sleep level (e.g., the BIS ratio was estimated to be 40% in the sleep state), unlike other BIS monitoring machines that adjust the anesthetic dose according to BIC value changes.


Methods
Auditory evoked potentials
Auditory evoked potentials are a physiological measure of the response of subcortical and cortical nerve centers to an auditory stimulus. This response can be divided into three successive series of positive and negative waves: the first is the early response (EAEP), which reflects brainstem activity; the second is the mean latency response (MAEP), which reflects the early cortical response; and the final is the late cortical response (LAEP). Only the auditory evoked potentials at medium latency can be used to measure the anesthesia depth. The latency and amplitude of Nb waves and Pa (Figure 1) are the main parameters usually analyzed. The average latency of PEA predicts loss of consciousness under propofol, according to the findings of Iselin-Chaves in 200010.


Stimuli used to produce AEP consist of spikes (brief 100-microsecond square wave) or tone bursts (brief sinusoidal waveforms). The choice of stimulus type has minimal impact on anesthesia applications. The stimuli must be delivered at intensities above the hearing level. The scalp location with the largest AEP amplitude is usually the vertex (Cz). The steady-state response evoked by stimuli delivered at rates near 40 seconds (the 40 Hz auditory steady-state response (ASSR); Figure 2) has been used extensively to assess anesthetic effects. Transient responses are classified according to their latency as fast (6–10 ms), middle (10–50 ms), slow (50–250 ms), and late (over 250 ms) responses11. The AEP acquisition protocol with standard brain response and latency values is illustrated in Figure 212.
In 2001, Danmeter13 introduced the first AEP monitor to the biomedical market. The monitor detects the AEP index using an autoregressive model (AAI), which can be displayed on two scales: 0–100 or 0–60. For optimal anesthesia, the index value varies between 15 and 2514. Musizza and Ribaric (2010)15 presents the AEP algorithm and AAI index.
BIS monitoring
EEG BIS is a spectral and statistical analysis method based on an algorithm developed using a large patient database. It measures the coherence of the EEG components and their frequency synchronization. The deeper the level of anesthesia is, the greater the consistency and synchronization will be. The EEG signals are collected from disposable self-adhesive electrodes placed on the areas hairless of the scalp, as illustrated in Figure 3. These electrodes are connected to a converter amplifier and a signal processing unit for filtering, feature extraction, and processing. BIS is easy to use and predictive of the hypnosis depth induced by propofol5.
To date, only one large-scale study has examined the use of BIS while taking propofol. Zhang et al. performed a randomized controlled trial including 5,228 patients with propofol and found that the risk of regaining consciousness was significantly reduced in the BIS-guided cohort (0.14%) than that in the cohort without BIS (0.65%). However, BIS has several limitations, the most striking of which is the wide range of values obtained for the same endpoint, making it very difficult to establish a valid individual threshold for loss of consciousness16, 17. Many artifacts, such as pacemakers, drugs, intra-abdominal irrigation, and the electromyogram, interfere with the signal18.
Figure 4 represents the principle of the algorithm of the BIS monitor. After the acquisition and reading of the EEG signal, it is then digitized, preprocessed, and filtered to remove artifacts from eye movements and power grid interference. The preprocessed data are used to calculate the parameter of the ratio β. This parameter is calculated as the ratio between 30–47 Hz and 11–20 Hz frequency bands. The parameter synchrony-fast-slow is calculated by bispectral analysis. It is defined as the ratio between the sum of all spectral peaks between 0.5 and 47 Hz and the sum of all spectral peaks over the 40–47 Hz interval19. Finally, all parameters are computed to deduce the BIS index according to Equation 1. The BIS algorithm is based on the same principle as phase lag entropy20, 21.
The bispectrum measures the correlation between signal phases at different Fourier frequencies. It is defined as an FFT-2D of third-order cumulates of a random process and is characterized by the bicoherence index (BIC), which varies between 0 and 100%22. According to the power density P(f), the correlation index (BIC) expression can be expressed as:
With


| Pourcentage of hypnotics | ERP index | Latency in ms |
|---|---|---|
| 1 % | 92 | 128 |
| 2.6 % | 20 | 430 |
| 4% | 12 | 1285 |

Results
Electrode standard positions
The EEG represents the time-varying trace of the electrical potential collected on the skull for different points of the scalp. EEG acquisition facilitates the visualization of brain process activity and our understanding of neurophysiologic phenomena. EEG signal acquisition was performed using electrodes placed in contact with the scalp at positions determined according to the international standard 10/2023. These locations are illustrated in Figure 5 and are explained in detail in the following section. Since EEG measures the brain's electrical activity, it can indicate the brain's state of sleep or sedation or any other activity. Unfortunately, the obtained and measured signals are very weak (a few microvolts) and require processing and amplification. Their amplitudes vary according to the patient’s age, sex, and condition24.
Extraction and classification of EEG waves
The analysis of EEG signals allows the extraction of five waves: delta, theta, alpha, beta, and gamma. These feature extractions help identify patients’ awake or sleep states during the night or when under anesthesia, as confirmed by Alferd Loomis25. Loomis found that the brain demonstrates electrical activity in neuronal regions. Variations in the fluctuations of these generated waves allow us to determine which wave dominates at a given moment. Each of the five waves is characterized by its frequency band and potential amplitude, as shown in figure 6. Each wakefulness state indicates a specific action potential corresponding to three parameters (awake state, light sleep state, and deep sleep state).
EEG recording can provide indicators of a person’s physical and mental state. For example, an EEG that shows high-amplitude alpha waves over the occipital area of the brain indicates that the person is relaxed and has their eyes closed. The alpha waves will disappear if they open their eyes26. Additionally, sleep researchers use recordings from entire nights to study and classify the different stages of sleep. The EEG waveforms of epileptic patients can also help localize seizure activity in the brain27, 28.
Every brain wave can be affected by the brain state as follows (Figure 6):
Figure 7 shows the effect of anesthesia and hypnotics on a person’s state and variation in the EEG brain waves. Note that the deeper the anesthesia is, the more brain waves demonstrate low frequencies with high amplitudes, and vice versa. The higher the analgesic and hypnotic level, the faster the B–A–T–D transition (Beta to Alpha to Theta to Delta)
Experimental
EEG is measured by using small electrodes attached to the scalp's surface. The number of electrodes can vary from 1 to 32 in the 10/20 scalp system or from 1 to 256 in the 10/10 system. The electrodes are placed at predefined positions according to the international 10/20 system or its variants. The weak electrical activity detected by the electrodes varies from 5 to 100 µV, and the frequency range of interest is between 1 and 40 Hz.
We used the international 10/20 system with 29 electrodes chosen from 32 according to meridians crossing the scalp. Every electrode is labeled with a letter that characterizes standard areas on the skull, as shown in Figure 5. These positions, which are reference points, are as follows: prefrontal (Fp), frontal (F), temporal (T), parietal (P), occipital (O), central (C), and cranial sagittal (Z). Even electrodes are on the right side of the head, while odd electrodes are on the left side29.
EEG database
The EEG database consists of two patients. The first is a 25-year-old man. The second is a 26-year-old female patient who was placed under anesthesia with 2.6% sevoflurane.
The protocol for EEG signal measurement followed the 10/20 architecture with 29 electrodes placed at prefrontal and temporal locations on the scalp, as defined in Figure 5.
EEG wave extraction and discrimination
The collected EEG data were transferred to a MATLAB signal processing algorithm to extract the EEG waves (temporal waveforms).Figure 8 illustrates the results of temporal and spectral analysis of the EEG signals.
The Delta–Alpha–Theta–Beta transition corresponds to the cycle of awakening from the state of sedation toward awareness. The experimental measurements produced the following results:
ERP and ICA components
An ERP is the measured brain response following a sensory, cognitive, or motor event. An ERP is considered an electrophysiological response to an internal or external stimulus. Studying ERPs provides a noninvasive way to assess brain function. ERP can be reliably measured using EEG signals associated with surface electrodes to record electrical activity from the cortex through the skull and scalp. However, due to the thousands of signals collected, the brain's response to a stimulus is rarely visible in the ongoing EEG. To address this issue, ERP monitors record the average of several dozen individual measurements of the stimulus of interest. This technique cancels noise and spontaneous EEG and improves the voltage response to the stimulus by making it stand out clearly from the average background. We used MATLAB and EEGLAB software to conduct parametric and statistical analyses of EEG signals. These tools are widely used in neurophysiology and biomedical signal processing. EEGLAB toolboxes and GUI include database import/export, EEG data analysis and visualization, artifact rejection, filtering, independent component analysis (ICA), and time-frequency analysis. The data sample consists of 100 EEG epochs sampled at 500 Hz. Figure 9 represents the real-time and experimental electrode positions and names on the scalp. For example, channel 14 is affected by the F3 electrode position. Figure 10 shows five sample epochs of the EEG data. Examination of scroll data variations allows for five epochs of data plotted at 29 electrode sites. In this example, two data epochs (colored 1 and 3 in Figure 10) were automatically flagged for rejection due to their out-of-range values and artifacts.
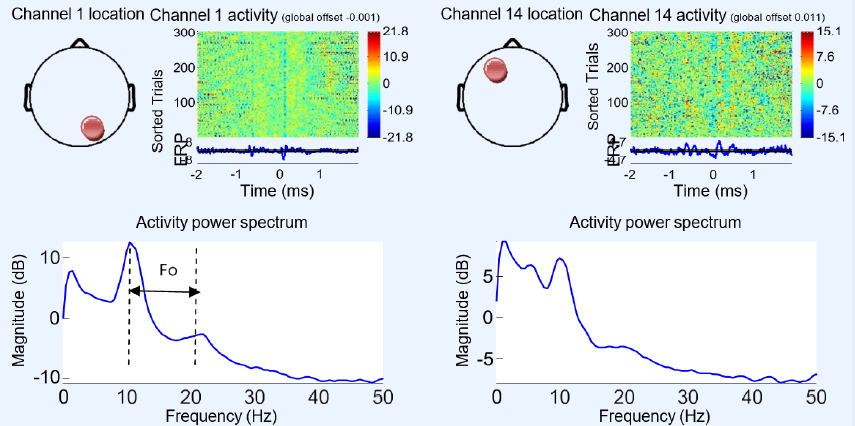
Figure 11, Figure 12, Figure 13, Figure 14, Figure 15 illustrate the process of constructing ERP image plots. An ERP image represents instantaneous trial potentials as colored horizontal lines. The average spectrum of the signal and a topography representative of the scalp are also presented. The red circles in Figure 11 on the scalp map indicate the electrode position and channel number corresponding to the data being imaged. A 10 Hz wavelet was applied for each trial to measure oscillatory activity in a time-centered 3-cycle window. We used EEGLAB to analyze the independent ICA component of each electrode to isolate the artifacts and the neighboring neuronal effects, revealing high intercorrelation. This strategy effectively detects and removes eye, muscle, and line noise artifacts.Figure 11 shows the electrode potential activity according to their spectrum and spectrogram. Regarding the two channels, or electrodes 1 and 14, the maximal activity is located at 10 Hz, and the detected wave frequency (Fo) is approximately 11 Hz. This indicates that the object state is between wakefulness and sleep with alpha brain wave activity.
However, in Figure 12, we illustrate another state with the same channel outputs, 1 and 14. The effects of the burst 10 Hz wavelets no longer occurred, and the spectrum demonstrates delta wave activity since the fundamental frequency is F1= 2 Hz. This indicates that the object state is anesthetized or in a deep sleep.
Figure 13-a shows the components representing the largest area of 10 Hz activity at the POz electrode (channel 29). The same figure shows the power spectrum of the selected channel (upper black trace), the activity spectra of the projection on this channel of each of the 29 components (Figure 13-b), and the scalp power distributions of the four most prominently contributing components 1, 2, 3, 4 and 5 (Figure 16-a). The envelopes of the five independent components (ICA) with the most important potentials (1, 2, 3, 4, and 5) have fundamental frequencies of approximately 12 Hz (alpha waves) and indicate that the object is under a moderate anesthesia state. The thick black traces in Figure 13-b show the envelope (all channels) of the ERP data, and the thin traces show the envelopes of the component contributions represented in the ERP.
In Figure 14, the ICA components (ERP and waveforms) illustrate the deep sleep or sedation state, showing the largest channel activities at the POz electrode (channel 29). We also demonstrate that the most significant electrode potentials are located in channels 1, 2, 3, 4, 5, 8, and 15. From these electrodes, the 1, 5, and channels are the most affected by sedation (red ERP inFigure 14).
To evaluate the latency of ten ERP signals, for the same experiments, we measured the latency of the POz electrode (channel 29), as illustrated in Figure 15. The obtained latency value is approximately 430 ms. This value is acceptable i surgery and reanimation and clinical resuscitation. This indicates that the motor response of a patient to painful stimulation is less than 0.5 seconds. This result is very important because it facilitates and accelerates the anesthesia process and can reduce the percentage of hypnotics and analgesics.Table 1 gives the obtained values of latency as a function of other cases of sedation with different values of hypnotics.
BIS experimental results
We used several experiments and tests under different conditions to evaluate the performance of the BIS method. Figure 16 shows some of our results. The upper part illustrates the evolution of anesthesia or sedation as a function of the BIS index.
Our findings demonstrate that the patient becomes immobile and without reactions from a BIS of 50 to 40. Therefore, increasing the hypnotic dose will have no effect. Additionally, the zone of 80 to 60 seems to be the most sensitive and important because the BIS varies and drops suddenly, which requires immediate control of the dosage to avoid overdose or underdose. Additionally, painful stimulation sharply increases the BIS, indicating the need for an analgesic in parallel with the hypnotic. The lower part of the figure demonstrates the most important variation in the hypnotic, which is in the range of 0.5 to 0.8 of the patient’s brain activity, corresponding to a BIS of 50 to 70.
Discussion
Our experimental results show that the BIS technique is more sensitive to the hypnotic component than the analgesic component. Intensive care clinicians use pain stimulation to observe motor reactions to obtain a correct prediction of the analgesic dose. During the induction of anesthesia and in the absence of painful stimulation, the BIS index decreases simultaneously with the loss of consciousness depending on the concentration of hypnotic used. Below a BIS of 40, it is advisable to increase the hypnotic dose to avoid underdosing and intraoperative awakening. When a painful stimulation is applied, a clinical motor reaction occurs if the analgesic component is insufficient, with a sudden increase in the BIS. This shows that the analgesia dose is insufficient and should be adjusted. Thus, the BIS constitutes a clinical aid to adjust the sleep component by controlling the hypnotic dosage before and during the surgical incision. The evoked auditory potential method that we used in the second stage appears advantageous because it enables not only the identification of the sedation state but also the monitoring of brain activity during anesthesia or sleep. The obtained latency values demonstrate that this technique provides a rapid response to audio stimulations that the medical operator cannot observe.
We compared our results with those reported in other published studies, such as those conducted by Weatherburn29, Zhao30, Ngai31, and Sachiko32. The results obtained are consistent with the previously reported conclusions and recommendations and affirm the superiority of the BIS technique for spontaneous EGG and the AEP technique for anesthesia monitoring by stimulation.
Conclusions
In conclusion, we developed a clinical tool for controlling the depth of general anesthesia. Our objective was twofold. First, to predict loss of consciousness, memorization, and motor reaction to a noxious stimulus; second, to measure the adequate concentrations of anesthetics and hypnotics to avoid overdose or under-dosing. To this end, we chose two methods, EAPs and the BIS, which were implemented and applied to patients according to standard protocols and the acquisition and treatment of EEG signals relative to cerebral activity. The results indicate the ability of this approach to extract and identify five EEG waves, each corresponding to a specific patient state, and effectively detect and identify the brain activity and patient state in real-time within 4 to 6 ms. These interesting findings can help medical staff better control and monitor anesthesia during surgical procedures, reduce the use of hypnotics, and contribute to better postoperative recovery. However, the limitation remains the prediction of the best analgesic–hypnotic dosage and the method’s sensitivity to different anesthetic administrations.
Abbreviations
None.
Acknowledgments
The author thanks the ISTMT institution and ATSSEE Laboratory for their collaboration.
Author’s contributions
Author B.L conceived the study, designed the experiments, performed statistical analysis and drafted the manuscript, and approved the final manuscript.
Funding
None.
Availability of data and materials
Data and materials used and/or analyzed during the current study are available from the corresponding author on reasonable request.
Ethics approval and consent to participate
Not applicable.
Consent for publication
Not applicable.
Competing interests
The authors declare that they have no known competing financial interests or personal relationships that could have appeared to influence the work reported in this paper. The authors declare that they have no competing interests.
References
-
Schmidt
P.H.,
Eggermont
J.J.,
Odenthal
D.W.,
Study of menière's disease by electrocochleography. Acta Oto-Laryngologica. Supplementum.
1974;
316
:
75-84
.
View Article PubMed Google Scholar -
Jewett
D.L.,
Williston
J.S.,
Auditory-evoked far fields averaged from the scalp of humans. Brain.
1971;
94
(4)
:
681-96
.
View Article PubMed Google Scholar -
Selters
W.A.,
Brackmann
D.E.,
Acoustic tumor detection with brain stem electric response audiometry. Archives of Otolaryngology (Chicago, Ill.).
1977;
103
(4)
:
181-7
.
View Article PubMed Google Scholar -
John
M.S.,
Picton
T.W.,
MASTER: a Windows program for recording multiple auditory steady-state responses. Computer Methods and Programs in Biomedicine.
2000;
61
(2)
:
125-50
.
View Article PubMed Google Scholar -
Tobias
J.D.,
Leder
M.,
Procedural sedation: A review of sedative agents, monitoring, and management of complications. Saudi Journal of Anaesthesia.
2011;
5
(4)
:
395-410
.
View Article PubMed Google Scholar -
Billard
V.,
Servin
F.,
Molliex
S.,
Monitoring the depth of general anesthesia. Anesthesia & Reanimation.
2016;
2
(1)
:
23-45
.
-
Biasiucci
A.,
Franceschiello
B.,
Murray
M.M.,
Electroencephalography. Current Biology.
2019;
29
(3)
:
80-5
.
View Article PubMed Google Scholar -
American Society of Anesthesiologists Task Force on Intraoperative Awareness. Practice advisory for intraoperative awareness and brain function monitoring. Anesthesiology.
2006;
104
:
847-64
.
-
Gan
T.J.,
Glass
P.S.,
Windsor
A.,
Payne
F.,
Rosow
C.,
Sebel
P.,
Utility Study Group
BIS,
Bispectral index monitoring allows faster emergence and improved recovery from propofol, alfentanil, and nitrous oxide anesthesia. Anesthesiology.
1997;
87
(4)
:
808-15
.
View Article PubMed Google Scholar -
Drummond
J.C.,
Weiskopf
R.B.,
Monitoring depth of anesthesia: with emphasis on the application of the bispectral index and the middle latency auditory evoked response to the prevention of recall. Anesthesiology.
2000;
93
(3)
:
876-82
.
View Article PubMed Google Scholar -
Plourde
G.,
Auditory evoked potentials. Best Practice & Research. Clinical Anaesthesiology.
2006;
20
(1)
:
129-39
.
View Article PubMed Google Scholar -
Paulraj
M.P.,
Subramaniam
K.,
Yaccob
S.B.,
Adom
A.H.,
Hema
C.R.,
Auditory evoked potential response and hearing loss: a review. The Open Biomedical Engineering Journal.
2015;
9
(1)
:
17-24
.
View Article PubMed Google Scholar -
Horn
B.,
Pilge
S.,
Kochs
E.F.,
Stockmanns
G.,
Hock
A.,
Schneider
G.,
A combination of electroencephalogram and auditory evoked potentials separates different levels of anesthesia in volunteers. Anesthesia and Analgesia.
2009;
108
(5)
:
1512-21
.
View Article PubMed Google Scholar -
Jeleazcov
C.,
Schneider
G.,
Daunderer
M.,
Scheller
B.,
Schüttler
J.,
Schwilden
H.,
The discriminant power of simultaneous monitoring of spontaneous electroencephalogram and evoked potentials as a predictor of different clinical states of general anesthesia. Anesthesia and Analgesia.
2006;
103
(4)
:
894-901
.
View Article PubMed Google Scholar -
Musizza
B.,
Ribaric
S.,
Monitoring the depth of anaesthesia. Sensors (Basel).
2010;
10
(12)
:
10896-935
.
View Article PubMed Google Scholar -
Sleigh
J.W.,
Donovan
J.,
Comparison of bispectral index, 95% spectral edge frequency and approximate entropy of the EEG, with changes in heart rate variability during induction of general anaesthesia. British Journal of Anaesthesia.
1999;
82
(5)
:
666-71
.
View Article PubMed Google Scholar -
Anderson
N.R.,
Wisneski
K.J.,
Automated analysis and trending of the raw EEG signal. American Journal of Electroneurodiagnostic Technology.
2008;
48
(3)
:
166-91
.
View Article PubMed Google Scholar -
Morimoto
Y.,
Monden
Y.,
Ohtake
K.,
Sakabe
T.,
Hagihira
S.,
The detection of cerebral hypoperfusion with bispectral index monitoring during general anesthesia. Anesthesia and Analgesia.
2005;
100
(1)
:
158-61
.
View Article PubMed Google Scholar -
Liu
Q.,
Chen
Y.F.,
Fan
S.Z.,
Maysam
F.,
EEG Signals Analysis Using Multiscale Entropy for Depth of Anesthesia Monitoring during Surgery through Artificial Neural Networks. Computational and Mathematical Methods in Medicine.
2015;
2015
:
1-16
.
View Article Google Scholar -
Hye Won Shin
All
Monitoring of anesthetic depth and EEG band power using phase lag entropy duringpropofol anesthesia. BMC Anesthesiology.
2020;
20
(49)
.
-
Miller
A.,
Sleigh
J.W.,
Barnard
J.,
Steyn-Ross
D.A.,
Does bispectral analysis of the electroencephalogram add anything but complexity?. British Journal of Anaesthesia.
2004;
92
(1)
:
8-13
.
View Article PubMed Google Scholar -
Garaud
T.,
Évaluation de la profondeur de l’anesthésie au cours des anesthésies halogénées : comparaison du moniteur d’Index Bispectral et du moniteur qCON. PHD thesis in medecine, 2018 , Faculté de Médecine PARIS DESCARTES, France.. 2018
.
-
Tran
Y.,
Din
R.,
Celestin Thierry and Aillet Morgan, Cerebral Functional Image . France: Docplayer; 2008. pp. 10–12. http://docplayer.fr/20382902-Imageries-fonctionnelles-cerebrales.html . 2008
.
-
Billiard
M.,
Normal and pathological sleep: sleep and wake disorders.Masson Edition: Paris; 1994.
Google Scholar -
Med
B.,
Hardware architecture for processing physiological signals in real time and adaptable to the variation of the operating environment, PHD Thesis National School of Engineering of sfax, 2009, Tunisia. 2009
.
-
Caparos
M.,
Automatic analysis of temporal lobe epileptic seizures from surface EEGs, Nancy Center for Automatic Research CNRS – UMR report 7039, 2010.
.
-
Wendling
F.,
Complexity of neural systems: contribution of signal processing and modeling in the interpretation of epileptic activities., Signal and Image Processing Laboratory, INSERM. University of Rennes.
2002;
2
:
3-9
.
-
Fahy
B.G.,
Chau
D.F.,
The Technology of Processed Electroencephalogram Monitoring Devices for Assessment of Depth of Anesthesia. Anesthesia and Analgesia.
2018;
126
(1)
:
111-7
.
View Article PubMed Google Scholar -
Weatherburn
C.,
Endacott
R.,
Tynan
P.,
Bailey
M.,
The impact of bispectral index monitoring on sedation administration in mechanically ventilated patients. Anaesthesia and Intensive Care.
2007;
35
(2)
:
204-8
.
View Article PubMed Google Scholar -
Zhao
D.,
Xu
Y.,
He
W.,
Li
T.,
He
Y.,
[A comparison of bispectral index and sedation agitation scale in guiding sedation therapy: a randomized controlled study in patients undergoing short term mechanical ventilation]. Zhongguo Wei Zhong Bing Ji Jiu Yi Xue.
2011;
23
(4)
:
220-3
.
PubMed Google Scholar -
Liu
N.,
Chazot
T.,
Genty
A.,
Landais
A.,
Restoux
A.,
McGee
K.,
Titration of propofol for anesthetic induction and maintenance guided by the bispectral index: closed-loop versus manual control: a prospective, randomized, multicenter study. Anesthesiology.
2006;
104
(4)
:
686-95
.
View Article PubMed Google Scholar -
Matsushita
S.,
Oda
S.,
Otaki
K.,
Nakane
M.,
Kawamae
K.,
Change in auditory evoked potential index and bispectral index during induction of anesthesia with anesthetic drugs. Journal of Clinical Monitoring and Computing.
2015;
29
(5)
:
621-6
.
View Article PubMed Google Scholar
Comments
Article Details
Volume & Issue : Vol 10 No 10 (2023)
Page No.: 5995-6008
Published on: 2023-10-31
Citations
Copyrights & License
This work is licensed under a Creative Commons Attribution 4.0 International License.
Search Panel
- HTML viewed - 5214 times
- PDF downloaded - 1142 times
- XML downloaded - 214 times
