

Copyrights: Ankita Girdhar, Kalyani Raju, Krishna Prasad, 2023. License: This work is licensed under a Creative Commons Attribution 4.0 International License.
Abstract
Background: Breast carcinoma (BC) is one of the most common malignancies in women, affecting 1 in 8.Interleukin 6 (IL6) is a proinflammatory cytokine. The role of IL6 pathways in breast cancer motivated the development of anti-IL6 agents or monoclonal antibodies, which inhibit the IL6/signal transducer and activator of transcription 3 (STAT3) pathway. This study aimed to determine the proportion and intensity of immunohistochemical (IHC) IL6 expression in invasive ductal carcinoma (IDC) breast tissue sections and estimate plasma IL6 levels using an enzyme-linked immunosorbent assay (ELISA) in the same patients to evaluate the association between IHC and plasma IL6 levels.
Methods: This laboratory observational cross-sectional study examined new primary BC cases between January 2021 and June 2022. IL6 IHC was performed on tissue sections and analyzed using the histochemical (H)-score system. Plasma samples were taken from the same cases to estimate IL6 levels using an ELISA. The data were analyzed for an association between IHC and plasma IL6 levels in paired samples using SPSS software (version 22).
Results: Among 50 IDC cases, the mean IHC-based IL6 H-score was 201.6 ? 88.4, and the mean ELISA-based plasma IL6 level was 68.13 ? 89.98 pg/mL. A slight positive correlation existed between IHC-based IL6 H-scores and ELISA-based plasma IL6 levels (p = 0.217). IHC-based IL6 H-scores were not associated with clinicopathological parameters. ELISA-based plasma IL6 levels were significantly associated with premenopausal status (p = 0.010), positive erb-b2 receptor tyrosine kinase 2 (ERBB2/HER2/NEU) expression (p = 0.040), low marker of proliferation Ki-67 (MKI67) index (p = 0.040), and the ERBB2/HER2/NEU enriched molecular category (p = 0.040).
Conclusion: IHC-based IL6 H-scores increased with ELISA-based plasma IL6 levels among the cases. ELISA-based plasma IL6 levels were significantly associated with premenopausal status, positive ERBB2/HER2/NEU expression, low Ki-67 proliferative index, and the ERBB2/HER2/NEU enriched molecular category. Therefore, plasma IL6 could be a potential marker to assess prognosis in patients with IDC.
Introduction
Breast cancer (BC) is the most common malignancy among women, with an estimated global incidence of 22,61,419 (11.7%) and mortality of 6,84,996 (6.9%) in 2020. The increased incidence of BC is one of the leading causes of cancer-related deaths worldwide1. The GLOBOCAN data for 2020 indicate that BC accounted for 13.5% (n = 178,361) of all cancer cases and 10.6% (n = 90,408) of all cancer-related deaths in India, with a cumulative risk of 2.811. In India, BC has a reported age-adjusted incidence among females of 25.8 per 100,000 population and mortality of 12.7 per 100,000 population. BC has a reported burden of 34.4% in Bangalore2 and a reported prevalence of 6.41% of all cancers in females in Kolar3.
Cytokines are a large group of proteins, glycoproteins, or peptides secreted by specific immune system cells. Cytokines include interleukins, colony-stimulating factors, interferons, and growth factors. Cytokines are primarily synthesized by leukocytes and primarily act on other leukocytes, leading them to be called interleukins (ILs)4, 5. ILs represent a large group of cytokines (IL-1 to IL-17) produced mainly by T cells, although some are also produced by mononuclear phagocytes and tissue cells (including adipocytes). Each IL acts on a specific group of cells with its corresponding receptors. IL6 is produced by macrophages and fibroblasts. Two types of IL6 receptors exist: transmembrane IL6 receptors expressed on the cell surface and soluble IL6 receptors in the circulation. They perform various functions, and their main role is directing other cells to divide and differentiate6, 7, 8.
Adipokines are molecules secreted by adipocytes and have an endocrine function. Cancer-associated adipocytes (adjacent to invasive BC tissue) contribute to BC progression and metastasis and secrete adipokines, including the cytokine IL67, 8. Cytokines form oligomeric protein complexes, bind with high affinity to transmembrane receptors, and induce IL6 cytokine family signal transducer (IL6ST/GP130) homo- or hetero-dimers, triggering intracellular signaling9, 10. IL6ST/GP130 dimerization induces the signal transduction and activation of various pathways, resulting in carcinogenesis. Therefore, anti-IL6 monoclonal antibodies are used as an adjuvant targeted therapy in BC and inhibit the IL6/signal transducer and activator of transcription 3 (STAT3) pathway11.
This study examined the immunohistochemical (IHC) expression of IL6 in invasive ductal carcinoma (IDC) breast tissue sections and estimated plasma IL6 levels in blood samples using an enzyme-linked immunosorbent assay (ELISA) from the same cases (paired samples). It also assessed the association between IL6 IHC expression and plasma ELISA levels, a liquid biopsy concept.
Methods
This laboratory observational cross-sectional study was conducted in a tertiary health care center of the Department of Pathology in collaboration with the Department of Surgery attached to Sri Devaraj Urs Medical College, Kolar, Karnataka, India, between January 2021 and June 2022. Its sample size was statistically estimated as 50 based on the study by Ahmad N et al.12. Its inclusion criteria were new cases of IDC of the breast diagnosed by fine needle aspiration cytology (FNAC)/trucut biopsy. Its exclusion criteria were BC cases already given chemotherapy or radiotherapy or with metastatic deposits in the breast, BC recurrence, any other malignancy, and chronic inflammatory disorders.
This study received ethical approval from the Institutional Ethics Committee (approval no.: DMC/KLR/IEC/688/2022-23) before being conducted. Informed consent was obtained from the study participants before starting the study. Case details were collected from the case files and interactions with the patient, including their age; clinical presentation; relevant laboratory and radiological investigations; lesion site; tumor size; surrounding structure involvement; nipple and areola involvement, including skin changes; and the number of palpable lymph nodes. Cases were classified as normal, overweight, obese, severely obese, morbidly obese, and super obese according to Asian body mass index (BMI) criteria. The tumor’s clinical stage was noted. The breast tissue, either trucut or mastectomy specimens, was fixed in 10% neutral buffered formalin overnight and then grossed per the laboratory’s standard operating procedure, and representative portions were provided. The tissue portions were processed per the laboratory’s standard protocol. Tissue sections were stained with hematoxylin and eosin and analyzed for histomorphological features, including histopathological type, tumor-infiltrating lymphocytes (TILs), lymphovascular invasion (LVI), Nottingham prognostic index (NPI), and tumor grade according to the modified Scarff–Bloom–Richardson (SBR) grading system. The tumor’s estrogen receptor 1 (ESR1/ER), progesterone receptor (PGR/PR), erb-b2 receptor tyrosine kinase 2 (ERBB2/HER2/NEU), and marker of proliferation Ki-67 (MKI67) status were captured from pathology department records.

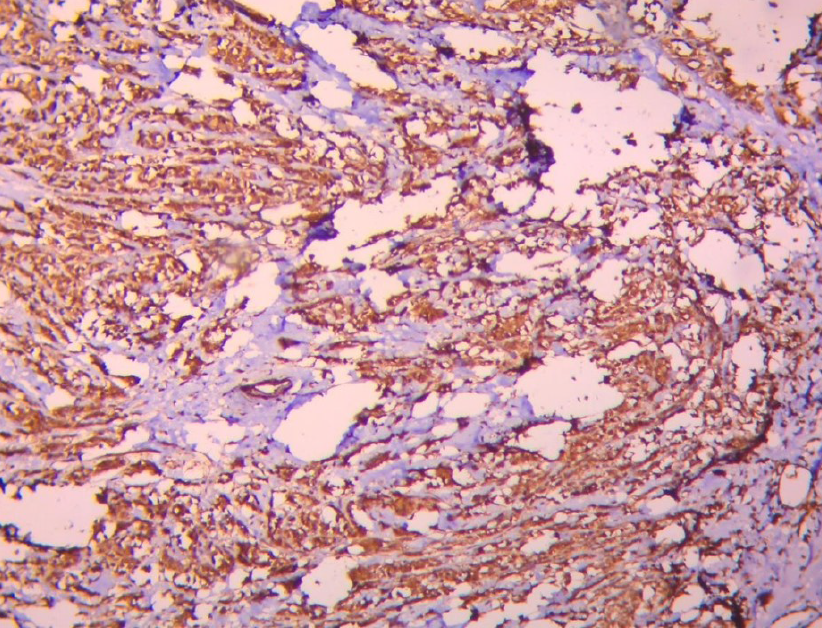
Tissue sections were subjected to IHC for IL6 using a rabbit polyclonal immunoglobulin G primary antibody (cat. no.: GTX109204; GeneTex) according to the manufacturer’s protocol. The test was run with positive (tonsil) and negative controls. Cytoplasmic staining was considered positive (Figure 1). IHC was scored using the histochemical (H) intensity grading score calculated with the following formula: (% of weakly-stained cells × 1) + (% of moderately-stained cells × 2) + (% of strongly-stained cells × 3)12, 13. The H-score ranged from 0 to 300.
A 6 mL blood sample was taken from the patient in a K2EDTA vacutainer after confirmation of IDC diagnosis by either FNAC or trucut biopsy and before the patient underwent a mastectomy. The blood sample was centrifuged at 1500 rpm for 10 minutes to separate the plasma. The plasma IL6 concentration was estimated using the Human IL6 ELISA Kit (Diaclone) according to the manufacturer’s protocol and expressed as pg/mL. IHC-based IL6 H-scores were correlated with ELISA-based plasma IL6 levels.
The data were entered in an MS Excel sheet. Statistical analyses were performed using IBM SPSS software (version 22). Continuous data are expressed as means and standard deviations with confidence intervals. Categorical data were expressed as frequencies and percentages. The significance of differences was assessed using the chi-square test. The correlation between IHC-based IL6 H-scores and ELISA-based plasma IL6 levels was assessed using Pearson’s correlation coefficient. Results with a p-value of < 0.05 were considered statistically significant.
| Basic characteristics | Frequency | Percentage (%) | |
|---|---|---|---|
| Age category | 35 - 45 | 6 | 12.0 |
| 46 - 55 | 18 | 36.0 | |
| 56 - 65 | 20 | 40.0 | |
| 66 – 75 | 6 | 12.0 | |
| Menopausal Status | Premenopausal | 13 | 26.0 |
| Postmenopausal | 37 | 74.0 | |
| Parity | Multipara | 47 | 96 |
| Primipara | 3 | 4 | |
| BMI | Underweight | 14 | 28.0 |
| Normal | 32 | 64.0 | |
| Overweight | 4 | 8.0 | |
| Tumor Infiltrating lymphocytes (TIL) | Absent | 33 | 66 |
| Present | 17 | 34 | |
| Lymphovascular Invasion (LVI) | Absent | 49 | 98 |
| Present | 1 | 2 | |
| pT (Tumor size) | T1 | 13 | 26 |
| T2 | 33 | 66 | |
| T3 | 3 | 6 | |
| T4 | 1 | 2 | |
| Metastatic lymph Nodes | Absent | 48 | 96.0 |
| Present | 2 | 4.0 | |
| Staging | I | 12 | 24 |
| II | 36 | 72 | |
| III | 2 | 4 | |
| Nottingham Grading | Grade 1 | 10 | 20 |
| Grade 2 | 23 | 46 | |
| Grade 3 | 17 | 34 | |
| Nottingham Prognostic Index (NPI) | Moderate | 11 | 22 |
| Good | 39 | 78 | |
| ER | Negative | 29 | 58 |
| Positive | 21 | 42 | |
| PR | Negative | 31 | 62 |
| Positive | 19 | 38 | |
| HER2 NEU | Negative | 35 | 70 |
| Positive | 15 | 30 | |
| Ki67 | <14% | 21 | 42 |
| >14% | 29 | 58 | |
| Molecular Classification | Luminal A | 8 | 16 |
| Luminal B | 13 | 26 | |
| HER-2 enriched | 9 | 18 | |
| Triple Negative | 20 | 40 | |
| IL-6 | IHC score | ELISA levels (pg/ml) | ||
|---|---|---|---|---|
| Mean | SD | Mean | SD | |
| Mean + SD | 201.60 | 78.04 | 68.13 | 37.70 |
| N (%) | IHC Score | p value | ELISA Levels (pg/ml) | p value | |||
|---|---|---|---|---|---|---|---|
| Mean | SD | Mean | SD | ||||
| Age Group | |||||||
| 35 - 45 | 6 (12%) | 196.29 | 109.96 | 0.964 | 62.04 | 19.50 | 0.203 |
| 46 - 55 | 18 (36%) | 209.44 | 64.12 | 70.50 | 40.29 | ||
| 56 - 65 | 20 (40%) | 198.01 | 80.56 | 76.38 | 41.76 | ||
| 66 - 75 | 6 (12%) | 195.00 | 93.50 | 39.60 | 9.12 | ||
| Total | 50 (100%) | 201.60 | 50.97 | 68.13 | 37.70 | ||
| Menopausal status | |||||||
| Premenopausal | 13 (26%) | 216.92 | 83.20 | 0.416 | 90.32 | 37.47 | 0.012 |
| Postmenopausal | 37 (74%) | 196.22 | 76.60 | 60.33 | 35.01 | ||
| Total | 50 (100%) | 201.60 | 78.04 | 68.13 | 37.70 | ||
| Parity | |||||||
| Primipara | 3 (6%) | 206.67 | 66.583 | 0.904 | 40.25 | 6.755 | 0.189 |
| Multipara | 47 (94%) | 201.28 | 79.335 | 69.91 | 38.18 | ||
| Total | 50 (100%) | 201.60 | 50.97 | 68.13 | 37.70 | ||
| BMI | |||||||
| Underweight (< 18.5) | 14 (28%) | 208.57 | 71.88 | 0.924 | 68.52 | 34.97 | 0.995 |
| Normal (18.5 - 24.9) | 32 (64%) | 198.44 | 81.56 | 68.18 | 39.23 | ||
| Overweight (25 - 29.9) | 4 (8%) | 202.50 | 89.58 | 66.35 | 44.78 | ||
| Total | 50 (100%) | 201.60 | 78.04 | 68.13 | 37.70 | ||
| N(%) | IHC Score | p value | ELISA Levels (pg/ml) | p value | |||
|---|---|---|---|---|---|---|---|
| Mean | SD | Mean | SD | ||||
| TIL | |||||||
| Absent | 33 (66%) | 190.91 | 79.93 | 0.180 | 64.93 | 33.09 | 0.408 |
| Present | 17 (34%) | 222.35 | 71.98 | 74.35 | 45.82 | ||
| Total | 50 (100%) | 201.60 | 78.04 | 68.13 | 37.70 | ||
| LVI | |||||||
| Absent | 49 (98%) | 204.29 | 76.48 | 0.089 | 69.01 | 37.56 | 0.337 |
| Present | 1 (2%) | 70.00 | - | 24.85 | - | ||
| Total | 50 (100%) | 167.87 | 76.67 | 68.13 | 37.70 | ||
| N (%) | IHC Score | p value | ELISA Levels (pg/ml) | p value | |||
|---|---|---|---|---|---|---|---|
| Mean | SD | Mean | SD | ||||
| Tumour size (pT) | |||||||
| T1 | 13 (26%) | 207.57 | 71.88 | 0.950 | 73.79 | 64.79 | 0.850 |
| T2 | 33 (66%) | 213.22 | 76.60 | 78.98 | 54.18 | ||
| T3 | 3 (6%) | 201.65 | 66.53 | 69.34 | 34.65 | ||
| T4 | 1 (2%) | 197.22 | 75.60 | 69.98 | 55.18 | ||
| Total | 50 (100%) | 203.65 | 66.63 | 70.34 | 34.65 | ||
| Metastatic lymph nodes (pN) | |||||||
| Positive | 48 (96%) | 202.08 | 78.33 | 0.833 | 75.07 | 51.64 | 0.389 |
| Negative | 2 (4%) | 190.00 | 98.99 | 42.99 | 3.87 | ||
| Total | 50 (100%) | 198.67 | 85.45 | 58.56 | 25.67 | ||
| Staging | |||||||
| I | 12 (24%) | 169.17 | 78.21 | 0.443 | 93.09 | 40.71 | 0.363 |
| II | 36 (72%) | 211.39 | 78.27 | 67.12 | 36.73 | ||
| III | 2 (4%) | 220.00 | - | 43.96 | - | ||
| Total | 50 (100%) | 213.45 | 75.65 | 65.65 | 34.56 | ||
| N (%) | IHC Score | p value | ELISA Levels (pg/ml) | p-value | |||
|---|---|---|---|---|---|---|---|
| Mean | SD | Mean | SD | ||||
| Modified SBR grading | |||||||
| Grade 1 | 10 (20%) | 183.00 | 66.67 | 0.613 | 57.50 | 16.58 | 0.093 |
| Grade 2 | 23 (46%) | 200.43 | 90.02 | 90.69 | 66.06 | ||
| Grade 3 | 17 (34%) | 214.12 | 68.01 | 60.50 | 32.23 | ||
| Total | 50 (100%) | 211.65 | 66.53 | 68.34 | 34.65 | ||
| NPI | |||||||
| Good (< 3.4) | 39 (78%) | 194.62 | 81.36 | 0.237 | 77.58 | 54.80 | 0.327 |
| Moderate (3.4 – 5.4) | 11 (22%) | 226.36 | 61.85 | 60.34 | 32.65 | ||
| Total | 50 (100%) | 223.54 | 78.78 | 72.34 | 43.45 | ||
| N (%) | IHC Score | p value | ELISA Levels (pg/ml) | p value | |||
|---|---|---|---|---|---|---|---|
| Mean | SD | Mean | SD | ||||
| ER | |||||||
| Positive | 21 (42%) | 195.24 | 71.80 | 0.629 | 82.86 | 48.41 | 0.289 |
| Negative | 29 (58%) | 206.21 | 83.21 | 67.22 | 52.60 | ||
| Total | 50 (100%) | 201.76 | 77.87 | 77.86 | 49.76 | ||
| PR | |||||||
| Positive | 19 (38%) | 199.47 | 74.34 | 0.882 | 80.89 | 48.20 | 0.446 |
| Negative | 31 (62%) | 202.90 | 81.41 | 69.44 | 32.90 | ||
| Total | 50 (100%) | 201.54 | 76.65 | 75.76 | 50.65 | ||
| HER2Neu | |||||||
| Positive | 15 (30%) | 212.00 | 66.35 | 0.543 | 96.14 | 71.81 | 0.041 |
| Negative | 35 (70%) | 197.14 | 83.05 | 64.21 | 36.15 | ||
| Total | 50 (100%) | 208.87 | 75.65 | 78.54 | 45.65 | ||
| Ki67 | |||||||
| < 14% | 21 (42%) | 186.19 | 77.42 | 0.543 | 86.56 | 65.19 | 0.041 |
| > 14% | 29 (58%) | 212.76 | 77.91 | 64.54 | 36.06 | ||
| Total | 50 (100%) | 198.76 | 77.76 | 77.12 | 44.78 | ||
| Molecular Classification | N (%) | IHC Score | ELISA Levels (pg/ml) | ||
|---|---|---|---|---|---|
| Mean | SD | Mean | SD | ||
| Luminal A | 8 (16%) | 205.00 | 76.15 | 96.11 | 52.77 |
| Luminal B | 13 (26%) | 189.23 | 71.46 | 74.72 | 45.76 |
| Her2 enriched | 9 (18%) | 230.00 | 65.57 | 178.76 | 77.76 |
| Triple negative | 20 (40%) | 195.50 | 89.47 | 54.38 | 18.07 |
| Total | 50 (100%) | 74.54 | 46.06 | 68.13 | 37.70 |
| p value | 0.660 | 0.051 | |||
Results
This study examined 50 IDC cases. Their basic data are shown in Table 1. Their mean IHC-based H-score of IL6 expression was 201.60 ± 78.04, and their mean ELISA-based plasma IL6 concentration was 68.13 ± 37.70 pg/mL (Table 2). A slight positive correlation existed between IHC-based IL6 H-scores and ELISA-based plasma IL6 levels (p = 0.217).
Most cases included in this study were aged 56–65 years (40%). The mean IHC-based IL6 H-score was highest in cases aged 46–55 years (209.44 ± 64.12). The mean ELISA-based plasma IL6 concentration was highest in cases aged 56–65 years (76.38 ± 41.76 pg/mL). Mean IHC-based IL6 H-scores and mean ELISA-based plasma IL6 levels did not differ significantly between age groups. Thirteen (26%) cases were premenopausal, and this group had the highest mean IHC-based IL6 score (216.92 ± 83.20) and mean ELISA-based plasma IL6 concentration (90.32 ± 37.47 pg/mL). The mean ELISA-based plasma IL6 level was significantly associated with menopausal status (p = 0.010). Regarding parity, 47 (94%) cases were multipara, and three (4%) were primipara. The mean IHC-based IL6 H-score (206.67 ± 66.58) was highest in primipara cases, and the mean ELISA-based plasma IL6 level (69.91 ± 38.18 pg/mL) was highest among multipara cases, although the differences were not statistically significant. Regarding BMI, 32 (64%) cases were normal, 14 (28%) were underweight, and four (8%) were overweight. The mean IHC-based IL6 H-score (208.57 ± 71.8) and mean ELISA-based plasma IL6 level (68.52 ± 34.97 pg/mL) were highest among underweight cases, although the differences were not statistically significant (Table 3).
In this study, 33 (66%) cases did not have TILs. The mean IHC-based IL6 H-score (222.35 ± 71.98) and mean ELISA-based plasma IL6 level (74.35 ± 45.82 pg/mL) were highest among cases positive for TILs, although the differences were not statistically significant. In addition, 49 (98%) cases did not show LVI. The mean IHC-based IL6 H-score (204.29 ± 76.48) was highest among cases without LVI. In contrast, the mean ELISA-based plasma IL6 level was highest among cases with LVI (69.01 ± 37.56 pg/mL). However, the differences were not statistically significant (Table 4).
In this study, 33 (66%) cases were in the T2 stage. The mean IHC-based IL6 H-score (213.22 ± 76.6) and the mean ELISA-based plasma IL6 level (78.98 ± 54.18 pg/mL) were highest among cases in the T2 stage, although the differences were not significant. In addition, 48 (96%) cases showed no metastatic lymph nodes. The mean IHC-based IL6 H-score (202.08 ± 78.33) and mean ELISA-based plasma IL6 level (75.07 ± 51.64 pg/mL) were highest among cases without metastatic lymph nodes, although the differences were not statistically significant. Moreover, 36 (72%) cases were in Stage II. The mean IHC-based IL6 H-score was highest among the two (4%) cases in Stage III, with a score of 220. In contrast, the mean ELISA-based plasma IL6 level was highest among the 12 (24%) cases in Stage I (93.09 ± 40.71 pg/mL). The association was not statistically significant (Table 5).
In this study, 23 (46%) cases were in Grade 2 on the modified SBR scale. The mean IHC-based IL6 H-score was highest among the 17 (34%) cases with modified SBR Grade 3 (214.12 ± 68.01). In contrast, the mean ELISA-based plasma IL6 level was highest among the 23 (46%) cases with modified SBR Grade 2 (90.69 ± 66.06 pg/mL). However, the associations were not statistically significant. In addition, 39 (78%) cases had a good NPI. The mean IHC-based IL6 H-score was highest among the 11 (22%) cases with a moderate NPI (226.36 ± 61.85). In contrast, the mean ELISA-based plasma IL6 level was highest among the 39 (78%) cases with a good NPI (77.58 ± 54 pg/mL). However, the associations were not statistically significant (Table 6).
In this study, 29 (58%) cases showed negative ER expression. The mean IHC-based IL6 H-score was highest among the 29 (58%) cases with negative ER expression (206.21 ± 83.21). In contrast, the mean ELISA-based plasma IL6 level was highest among the 21 (42%) cases with positive ER expression (82.86 ± 48.41 pg/mL). However, associations were not statistically significant. In addition, 31 (62%) cases showed negative PR expression. The mean IHC-based IL6 H-score was highest among the 31 (62%) cases with negative PR expression (202.90 ± 81.41). In contrast, the mean ELISA-based plasma IL6 level was highest among the 19 (38%) cases with positive PR expression (80.89 ± 48.20 pg/mL). However, the associations were not statistically significant. Moreover, 35 (70%) cases showed negative ERBB2/HER2/NEU expression. The mean IHC-based IL6 H-score was highest among the 15 (30%) cases with positive ERBB2/HER2/NEU expression (212.00 ± 66.35). Similarly, the mean ELISA-based plasma IL6 level was highest among the 15 (30%) cases with positive ERBB2/HER2/NEU expression (96.14 ± 71.81 pg/mL), showing a statistically significant association (p = 0.040). Furthermore, 29 (58%) cases had a high Ki-67 proliferative index. The mean IHC-based IL6 H-score was highest among the 29 (58%) cases with a high Ki-67 proliferative index (212.76 ± 77.00). In contrast, the mean ELISA-based plasma IL6 level was highest among the 21 (42%) cases with a low Ki-67 proliferative index (86.56 ± 65.19 pg/mL), showing a statistically significant association (p = 0.040; Table 7).
Regarding molecular classification, most cases (91.40%) were triple negative. The mean IHC-based IL6 H-score (230.00 ± 65.57) and mean ELISA-based plasma IL6 level (178.65 ± 77.56 pg/mL) were highest in the ERBB2/HER2/NEU-enriched category (18%). Moreover, the mean ELISA-based plasma IL6 level was significantly associated with the ERBB2/HER2/NEU-enriched category (p = 0.04).
Discussion
Several factors produced by cancer-associated fibroblasts (CAFs), such as tumor growth factor beta 1 (TGFB1/TGFß) and C-X-C motif chemokine ligand 12 (CXCL12/SDF1), are involved in promoting malignant transformation in epithelial cells. CAFs represent a population or group of stromal cells that can promote tumor cell growth via stromal-epithelial paracrine signaling. They secrete proinflammatory cytokines such as IL6, contributing to various responses that help the tumor in different ways14. It has been established that persistent inflammation in the tumor microenvironment promotes tumor growth and the development of resistance to radiation and chemotherapy. BC is one of many cancers where IL6 over-expression has been observed in the tumor microenvironment. Tumor cells and tumor-associated fibroblasts were the primary sources of IL6 released into the tumor microenvironment. The importance of IL6’s immunopathogenic function and signaling in the development, metastasis, and therapy of tumors has been well established by several studies15.
In this study, the IHC-based IL6 H-scores increased with ELISA-based plasma IL-6 levels, although this correlation was not statistically significant (p = 0.217).
In this study, 40% of the cases were aged 56–65 years. The mean IHC-based IL6 H-score was highest in those aged 46–55 years (209.51 ± 64.12). Lee et al. found that the average age of patients with BC was 49.8 years16. Osuala KO et al. reported that the average age of patients with BC was 49.5 years and that 65% showed IL6 expression on IHC. While there was no association between age and IHC-based IL6 expression, high IHC-based IL6 expression was associated with poor outcomes14. In this study, the mean ELISA-based plasma IL6 level was highest among cases aged 56–65 years (76.38 ± 41.76 pg/mL). However, no association existed between ELISA-based plasma IL6 levels and age. Importantly, no other studies have examined this association.
In this study, 26% of the cases were premenopausal, and 74% were postmenopausal. Surakasula et al. reported that 54% of their cases were postmenopausal17. The mean IHC-based IL6 H-score was 216.92 ± 83.20 among premenopausal cases and 196.22 ± 76.60 among postmenopausal cases. However, menopausal status was not significantly associated with IHC-based IL6 H-scores. The mean ELISA-based plasma IL6 level was 90.32 ± 37.47 pg/mL among premenopausal cases and 60.3 ± 35.01 pg/mL among postmenopausal cases. Menopausal status was significantly associated with ELISA-based plasma IL6 levels (p = 0.010). However, limited data regarding this association are available in the English literature for comparison.
In this study, 6% of the cases were primipara, and 94% were multipara. Fortner et al. reported that 13% of their participants were primipara, and 77% were multipara18. The mean IHC-based IL6 H-score was 206.67 ± 65.58 among primipara cases and 201.00 ± 79.30 among multipara cases. However, there was no statistically significant association. Limited data regarding this association are available in the English literature for comparison.
In this study, 64% of the cases had normal BMI, 28% were underweight, and 8% were overweight. Jee et al. and Palmer et al. reported that 53% and 73% of participants had normal BMI levels, respectively19, 20. The mean IHC-based IL6 H-score was 88.74 ± 72.98 among cases with a normal BMI, 18.00 ± 39.23 among cases with an underweight BMI, and 66.35 ± 44.78 among cases with an overweight BMI. The mean ELISA-based plasma IL6 level was 68.18 ± 39.23 pg/mL among cases with a normal BMI, 68.52 ± 34.97 pg/mL among cases with an underweight BMI., and 66.35 ± 37.70 pg/mL among cases with an overweight BMI. However, the differences between groups were not statistically significant. Teixeira et al. reported that ELISA-based plasma IL6 levels were 0.90 pg/mL among cases with a normal BMI and 0.64 pg/ml among cases with an obese BMI21.
In this study, the mean IHC-based IL6 H-score was 190.91 ± 79.93 among cases without and 222.35 ± 71.98 among cases with TILs. The mean ELISA-based plasma IL6 level was 73.50 ± 54.12 pg/mL among cases without and 74.35 ± 45.82 pg/mL among patients with TILs. However, the differences between groups were not statistically significant. To our knowledge, no study on this association is available in the English literature for comparison.
In this study, the mean IHC-based IL6 H-score was 204.79 ± 76.48 among cases without and 70 among cases with LVI. The mean ELISA-based plasma IL6 level was 674.79 ± 37.56 pg/mL among cases without and 24.85 pg/mL among cases with LVI. However, the differences between groups were not statistically significant. Limited data on this association are available in the English literature for comparison.
In this study, the mean IHC-based IL6 H-score was 207.57 ± 71.88 among T1-stage cases, 213.22 ± 76.60 among T2-stage cases, 201.65 ± 66.53 among T3-stage cases, and 197.22 ± 75.60 among T4-stage cases. The mean ELISA-based plasma IL6 level was highest among T2-stage cases (73.79 ± 64.79 pg/mL). However, the differences between groups were not statistically significant. Fontanini et al. reported no association between IL6 expression and tumor size or nodal status22. However, few published studies have examined this association for comparison.
In this study, the mean IHC-based IL6 H-score was 190.00 ± 98.99 among cases with and 202.08 ± 78.33 among cases without metastatic lymph nodes. The mean ELISA-based IL6 level was 42.99 ± 3.87 pg/mL among cases with and 75.07 ± 51.64 pg/mL among cases without metastatic lymph nodes. However, the differences between groups were not statistically significant.
In this study, the mean IHC-based IL6 H-score was 169.17 ± 78.21 among Stage-1 cases, 211.39 ± 78.27 among Stage-2 cases, and 220 among Stage-3 cases. The mean ELISA-based plasma IL6 level was 93.09 ± 40.71 pg/mL among Stage-1 cases, 67.12 ± 36.73 pg/mL among Stage-2 cases, and 43.96 pg/mL among Stage-3 cases. However, the differences between groups were not statistically significant. Osuala et al. reported a progressive and significant increase in IL6 levels with the disease stage14. Kozlowski et al. observed that 21% of patients with Stage 2/3 ductal carcinomas had a negative serum IL6 concentration23. Ravishankaran et al. showed that with increasing degrees of tumor invasion, the median plasma IL6 level increased proportionally with the cancer stage24.
In this study, the mean IHC-based IL6 H-score was 183.00 ± 66.67 among cases with Grade 1, 200.43 ± 90.02 among cases with Grade 2, and 214.12 ± 68.01 among cases with Grade 3. The mean ELISA-based plasma IL6 level was 57.50 ± 16.58 pg/mL among cases with Grade 1, 90.69 ± 66.06 pg/mL among cases with Grade 2, and 60.50 ± 32.23 pg/mL among cases with Grade 3. However, neither IL6 metric was significantly associated with tumor grade. Fontanini et al. reported a significant association between IHC-based IL6 expression and histological tumor grading, where low-grade tumors (Grade I) had higher IL6 expression than high-grade tumors. Approximately one-fifth of the investigated ductal carcinomas were classified as Grade I. None of these well-differentiated tumors was IL-6-negative. Since a high grade indicates less differentiated tumors, this finding suggests that reductions in IL6 expression are associated with the late stages of tumorigenesis22.
In this study, the mean IHC-based IL6 H-score was 194.62 ± 81.36 among the 78% of cases with a good NPI (< 3.4) and 226.36 ± 61.85 among the 22% of cases with a moderate NPI. The mean ELISA-based plasma IL6 level was 77.58 ± 54.80 pg/mL among cases with a good NPI and 60.34 ± 32.65 pg/mL among cases with a moderate NPI. However, the differences between groups were not statistically significant.
In this study, the mean IHC-based IL6 H-score was 195.24 ± 71.80, and the mean ELISA-based plasma IL6 level was 82.86 ± 48.41 pg/mL among ER-positive cases. However, the differences between groups were not statistically significant. Similar findings were also reported by Schillace et al., where higher plasma IL6 levels were observed among their ER-positive cases25. The mean IHC-based IL6 H-score was 206.21 ± 83.21 among ER-negative cases. Limited data on this association are available in the English literature for comparison. The mean ELISA-based plasma IL6 level was 67.22 ± 52.60 among ER-negative cases. The differences between groups were not statistically significant. Fontanini et al. reported that 68% of their study population was ER-negative, and among the 50 ER-negative tumors, 36 (72%) were IL6-positive with ELISA22. Schillace et al. reported similar findings, where ER-negative participants showed low ELISA-based IL6 levels25.
In this study, the mean IHC-based IL6 H-score was 202.90 ± 81.41 among PR-negative cases. However, the differences between groups were not statistically significant. Limited data on this association are available in the English literature for comparison. The mean ELISA-based plasma IL6 level was 69.44 ± 32.90 pg/mL among PR-negative cases. Schillace et al. reported that IL6 expression was highest among PR-negative participants25. In this study, the mean IHC-based IL6 H-score was 202.90 ± 81.41 among PR-positive cases. Limited data on this association are available in the English literature for comparison. In this study, PR-positive cases had low mean ELISA-based plasma IL6 levels. Schillace et al. reported similar findings, where their PR-positive study population has reduced plasma IL6 levels25.
In this study, the mean IHC-based IL6 H-score was 212.00 ± 66.35 among ERBB2/HER2/NEU-positive cases, higher than among ERBB2/HER2/NEU-negative cases. However, the association was not statistically significant. Limited data on this association are available in the English literature for comparison. In this study, the mean ELISA-based plasma IL6 level was 96.14 ± 71.81 pg/mL among ERBB2/HER2/NEU-positive cases and 64.21 ± 36.15 pg/mL among ERBB2/HER2/NEU-negative cases. The association was statistically significant (p = 0.040). Limited data on this association are available in the English literature for comparison.
The mean IHC-based IL6 H-score was 212.76 ± 77.91 among cases with a Ki-67 index of > 14% and 186.19 ± 77.42 among cases with a Ki-67 index of < 14%. Limited data on this association are available in the English literature for comparison. In this study, the mean ELISA-based plasma IL6 level was 86.56 ± 65.19 pg/mL among cases with a Ki-67 index of <14% and 64.54 ± 36.06 pg/mL among cases with a Ki-67 index of >14%. This association was statistically significant (p = 0.040). Limited data on this association are available in the English literature for comparison.
In this study, the mean IHC-based IL6 H-score was 205.00 ± 76.15 for luminal A cases, 189.23 ± 71.46 for luminal B cases, 230 ± 65.57 for ERBB2/HER2/NEU-enriched cases, and 195.50 ± 89.47 for triple-negative cases. Limited data on this topic are available in the English literature for comparison. The mean ELISA-based plasma IL6 level was 96.11 ± 52.77 pg/mL for luminal A cases, 74.72 ± 45.76 pg/mL for luminal B cases, 178.76 ± 77.76 pg/mL for ERBB2/HER2/NEU-enriched cases, and 54.38 ± 18.07 pg/mL for triple-negative cases. A statistically significant association existed between ELISA-based plasma IL6 levels and the ERBB2/HER2/NEU-enriched category (p = 0.040). Limited data on this topic are available in the English literature for comparison.
The limitations of this study were its small sample size and single-hospital design. However, the mean IHC-based IL6 H-score was 201.6 ± 88.4 and the mean ELISA-based plasma IL6 level was 68.13 ± 89.98 pg/mL among cases. A slight positive correlation existed between IHC-based IL6 H-scores and ELISA-based plasma IL6 levels (p = 0.217). IHC-based IL6 H-scores were not associated with clinicopathological parameters. However, the ELISA-based plasma IL6 levels were significantly associated with premenopausal status (p = 0.010), positive ERBB2/HER2/NEU expression (p = 0.04), low Ki-67 proliferation index (p = 0.040), and the ERBB2/HER2/NEU-enriched molecular category (p = 0.040).
Conclusions
The mean IHC-based IL6 H-score was 201.6 ± 88.4 and the mean ELISA-based plasma IL6 level was 68.13 ± 89.98 pg/mL among BC cases. IHC-based IL6 H-scores increased with ELISA-based plasma IL6 levels. The mean ELISA-based plasma IL6 level was significantly associated with the premenopausal phase, positive ERBB2/HER2/NEU expression, low K-i67 proliferative index, and the ERBB2/HER2/NEU-enriched molecular category. Therefore, ELISA-based plasma IL6 levels could be used as a potential prognostic parameter.
Abbreviations
BC: Breast cancer, BMI: Body mass index, EDTA: Ethylenediamine tetraacetic acid, ELISA: Enzyme-linked immunosorbent assay, ER: Estrogen receptor, FNAC: Fine needle aspiration cytology, HER2: Human epidermal growth factor receptor 2, IDC: Invasive ductal carcinoma, IHC: Immunohistochemical, IL: interleukin, LVI: Lymphovascular invasion, NPI: Nottingham prognostic index, PR: Progesterone receptor, SBR: Scarff–Bloom–Richardson, STAT: Signal transducer and activator of transcription, TILs: Tumor-infiltrating lymphocytes
Acknowledgments
None.
Author’s contributions
Ankita Girdhar: Data collection, statistical analysis, manuscript writing; Kalyani Raju: Concept, literature review, manuscript correction and editing; Krishna Prasad: Data collection, manuscript editing. All authors read and approved the final manuscript.
Funding
None.
Availability of data and materials
Data and materials used and/or analyzed during the current study are available from the corresponding author on reasonable request.
Ethics approval and consent to participate
Ethical approval taken from Institutional Ethics Committee (DMC/KLR/IEC/688/2022-23) and consent taken from the participants.
Consent for publication
Not applicable.
Competing interests
The authors declare that they have no competing interests.
References
-
Sung
H.,
Ferlay
J.,
Siegel
R.L.,
Laversanne
M.,
Soerjomataram
I.,
Jemal
A.,
Global Cancer Statistics 2020: GLOBOCAN Estimates of Incidence and Mortality Worldwide for 36 Cancers in 185 Countries. CA: a Cancer Journal for Clinicians.
2021;
71
(3)
:
209-49
.
View Article PubMed Google Scholar -
Kalyani
R.,
Das
S.,
Bindra Singh
M.S.,
Kumar
H.,
Cancer profile in the Department of Pathology of Sri Devaraj Urs Medical College, Kolar: a ten years study. Indian Journal of Cancer.
2010;
47
(2)
:
160-5
.
View Article PubMed Google Scholar -
Malvia
S.,
Bagadi
S.A.,
Dubey
U.S.,
Saxena
S.,
Epidemiology of breast cancer in Indian women. Asia Pacific Journal of Clinical Oncology.
2017;
13
(4)
:
289-95
.
View Article PubMed Google Scholar -
Vecchi
L.,
Mota
S.T.,
Zóia
M.A.,
Martins
I.C.,
de Souza
J.B.,
Santos
T.G.,
Interleukin-6 Signaling in Triple Negative Breast Cancer Cells Elicits the Annexin A1/Formyl Peptide Receptor 1 Axis and Affects the Tumor Microenvironment. Cells.
2022;
11
(10)
:
1705-15
.
View Article PubMed Google Scholar -
Holloway
A.F.,
Rao
S.,
Shannon
M.F.,
Regulation of cytokine gene transcription in the immune system. Molecular Immunology.
2002;
38
(8)
:
567-80
.
View Article PubMed Google Scholar -
Balkwill
F.R.,
Burke
F.,
The cytokine network. Immunology Today.
1989;
10
(9)
:
299-304
.
View Article PubMed Google Scholar -
Simpson
K.J.,
Lukacs
N.W.,
Colletti
L.,
Strieter
R.M.,
Kunkel
S.L.,
Cytokines and the liver. Journal of Hepatology.
1997;
27
(6)
:
1120-32
.
View Article PubMed Google Scholar -
Kastelein
R.A.,
Hunter
C.A.,
Cua
D.J.,
Discovery and biology of IL-23 and IL-27: related but functionally distinct regulators of inflammation. Annual Review of Immunology.
2007;
25
(1)
:
221-42
.
View Article PubMed Google Scholar -
Silver
J.S.,
Hunter
C.A.,
gp130 at the nexus of inflammation, autoimmunity, and cancer. Journal of Leukocyte Biology.
2010;
88
(6)
:
1145-56
.
View Article PubMed Google Scholar -
Knüpfer
H.,
Preiss
R.,
Lack of knowledge: breast cancer and the soluble interleukin-6 receptor. Breast Care (Basel, Switzerland).
2010;
5
(3)
:
177-80
.
View Article PubMed Google Scholar -
Heinrich
P.C.,
Behrmann
I.,
Haan
S.,
Hermanns
H.M.,
Müller-Newen
G.,
Schaper
F.,
Principles of interleukin (IL)-6-type cytokine signalling and its regulation. The Biochemical Journal.
2003;
374
(Pt 1)
:
1-20
.
View Article PubMed Google Scholar -
Ahmad
N.,
Ammar
A.,
Storr
S.J.,
Green
A.R.,
Rakha
E.,
Ellis
I.O.,
IL-6 and IL-10 are associated with good prognosis in early stage invasive breast cancer patients. Cancer Immunology, Immunotherapy.
2018;
67
(4)
:
537-49
.
View Article PubMed Google Scholar -
Bhaumik
A.,
Das
S.,
Sarkar
S.R.,
Chakraborty
P.,
Chowdhury
B.,
Immunohistochemical Diagnosis of Breast Cancer Cases with Prognostic Markers: ER, PR & HER2/1 Neu. Indian Journal Of Applied Research.
2015;
5
(7)
:
468-70
.
-
Osuala
K.O.,
Sameni
M.,
Shah
S.,
Aggarwal
N.,
Simonait
M.L.,
Franco
O.E.,
Il-6 signaling between ductal carcinoma in situ cells and carcinoma-associated fibroblasts mediates tumor cell growth and migration. BMC Cancer.
2015;
15
(1)
:
584-613
.
View Article PubMed Google Scholar -
Shimura
T.,
Shibata
M.,
Gonda
K.,
Murakami
Y.,
Noda
M.,
Tachibana
K.,
Prognostic impact of interleukin-6 and C-reactive protein on patients with breast cancer. Oncology Letters.
2019;
17
(6)
:
5139-46
.
View Article PubMed Google Scholar -
Lee
J.,
Oh
M.,
Ko
S.,
Park
C.,
Lee
E.S.,
Kim
H.A.,
Korean Breast Cancer Society. Parity Differently Affects the Breast Cancer Specific Survival from Ductal Carcinoma In Situ to Invasive Cancer: A Registry-Based Retrospective Study from Korea. Breast Cancer (Tokyo, Japan).
2019;
13
(1)
:
1-8
.
View Article PubMed Google Scholar -
Surakasula
A.,
Nagarjunapu
G.C.,
Raghavaiah
K.V.,
A comparative study of pre- and post-menopausal breast cancer: risk factors, presentation, characteristics and management. Journal of Research in Pharmacy Practice.
2014;
3
(1)
:
12-8
.
View Article PubMed Google Scholar -
Fortner
R.T.,
Sisti
J.,
Chai
B.,
Collins
L.C.,
Rosner
B.,
Hankinson
S.E.,
Parity, breastfeeding, and breast cancer risk by hormone receptor status and molecular phenotype: results from the Nurses' Health Studies. Breast Cancer Research.
2019;
21
(1)
:
40-9
.
View Article PubMed Google Scholar -
Jee
S.H.,
Yun
J.E.,
Park
E.J.,
Cho
E.R.,
Park
I.S.,
Sull
J.W.,
Body mass index and cancer risk in Korean men and women. International Journal of Cancer.
2008;
123
(8)
:
1892-6
.
View Article PubMed Google Scholar -
Palmer
J.R.,
Adams-Campbell
L.L.,
Boggs
D.A.,
Wise
L.A.,
Rosenberg
L.,
A prospective study of body size and breast cancer in black women. Cancer Epidemiology, Biomarkers {&}amp; Prevention.
2007;
16
(9)
:
1795-802
.
View Article PubMed Google Scholar -
Teixeira
S.V.,
Silva
I.L.,
Nunes
F.C.,
Campos
C.B.,
Oliveira
M.R.,
Lavalle
G.E.,
Serum evaluation of leptin, IL-6, IGF-1 and estrogen in obese bitches with early stages of mammary carcinoma. Arquivo Brasileiro de Medicina Veterin &{#}x00E1;ria e Zootecnia.
2019;
71
(1)
:
143-50
.
View Article Google Scholar -
Fontanini
G.,
Campani
D.,
Roncella
M.,
Cecchetti
D.,
Calvo
S.,
Toniolo
A.,
Expression of interleukin 6 (IL-6) correlates with oestrogen receptor in human breast carcinoma. British Journal of Cancer.
1999;
80
(3-4)
:
579-84
.
View Article PubMed Google Scholar -
Kozlowski
L.,
Zakrzewska
I.,
Tokajuk
P.,
Wojtukiewicz
M.Z.,
Concentration of interleukin-6 (IL-6), interleukin-8 (IL-8) and interleukin-10 (IL-10) in blood serum of breast cancer patients. Roczniki Akademii Medycznej w Białymstoku.
2003;
48
:
82-4
.
PubMed Google Scholar -
Ravishankaran
P.,
Karunanithi
R.,
Clinical significance of preoperative serum interleukin-6 and C-reactive protein level in breast cancer patients. World Journal of Surgical Oncology.
2011;
9
(18)
:
18
.
View Article PubMed Google Scholar -
Schillace
R.V.,
Skinner
A.M.,
Pommier
R.F.,
O'Neill
S.,
Muller
P.J.,
Naik
A.M.,
Estrogen receptor, progesterone receptor, interleukin-6 and interleukin-8 are variable in breast cancer and benign stem/progenitor cell populations. BMC Cancer.
2014;
14
(733)
:
733
.
View Article PubMed Google Scholar
Comments
Article Details
Volume & Issue : Vol 10 No 8 (2023)
Page No.: 5843-5854
Published on: 2023-08-31
Citations
Copyrights & License
This work is licensed under a Creative Commons Attribution 4.0 International License.
Search Panel
Pubmed
Google Scholar
Pubmed
Google Scholar
Pubmed
Search for this article in:
Google Scholar
Researchgate
- HTML viewed - 3788 times
- PDF downloaded - 1243 times
- XML downloaded - 94 times
