

Copyrights: Jahnavi Reddy Yeduguri, Kalyani Raju, Sreeramulu Patrapalli Nadipanna, 2023. License: This work is licensed under a Creative Commons Attribution 4.0 International License.
Abstract
Background: Breast cancer is a leading cause of cancer-related deaths in women globally. Various markers have been identified in breast cancer tissue, including estrogen receptors, progesterone receptors, human epidermal growth factor receptor 2, Ki67, and adipokine. The most crucial mediator in the relationship between obesity and breast cancer is leptin, which encourages the initiation, development, growth, and spread of tumors. Breast cancer development and progression are significantly influenced by leptin, which is present in both blood and tissue. This study aimed to evaluate the association between leptin immunohistochemistry (IHC) expression in tissue sections and leptin plasma levels by enzyme-linked immunosorbent assay (ELISA) in invasive ductal breast carcinomas and correlate this with clinicopathological parameters.
Methods: A laboratory observational cross-sectional study was conducted over 18 months. Tissue sections of invasive ductal breast carcinoma cases were collected for IHC leptin expression, and plasma leptin levels of the same cases were estimated by ELISA. The association of IHC leptin expression and plasma leptin levels with other clinicopathological parameters was determined. All data were entered into a Microsoft Excel spreadsheet and statistical analysis was performed using SPSS 22 software.
Results: Among the study population of 52 cases, 92.3% showed IHC leptin positivity. Plasma leptin levels ranged from 13.21 ? 79.54 ng/ml with a mean of 40.92 ? 20.05 ng/ml. The association of IHC leptin expression and plasma leptin levels was not statistically significant. Among the various clinicopathological parameters studied, the associations of IHC leptin expression with the size (p value-0.04) and stage (p value-0.05) of the tumor were statistically significant. ELISA leptin levels related to parity (p-value 0.04), estrogen receptors (p-value 0.01), and progesterone receptors (pvalue 0.005) were statistically significant.
Conclusion: IHC leptin positivity was identified in 92.3% of cases. The mean plasma ELISA leptin level was 40.92 ? 20.05 ng/ml. IHC leptin expression had a statistically significant association with the size and stage of the tumor, while plasma ELISA leptin levels had a statistically significant association with parity, estrogen, and progesterone receptors.
Introduction
Breast cancer (BC) is the most common cancer among women and is a leading cause of cancer-related deaths in women globally1. In 2018, there were 626,679 deaths and 2,088,849 new cases of breast cancer worldwide (11.6%)2. According to the American Cancer Society, BC is the most common cancer among women, accounting for over 1,700,000 newly diagnosed cases and 580,000 deaths in the US in 20151. According to the Saudi Cancer Registry, BC accounted for 25.8% of all recorded cancers in females in 20121. In India, the incidence of BC in the female population is 25.8 per 100,000 and the mortality rate is 12.7 per 100,000. The incidence of BC reported in Bangalore was 34.4%3, while that in Kolar was 6.4% of total cancers in women4.
Various markers have been identified in BC tissue, which include estrogen receptors (ER), progesterone receptors (PR), human epidermal growth factor receptor 2 (HER 2Neu), and Ki67. Some cancer-associated adipokines, such as leptin, adiponectin, interleukin-6 (IL-6), chemokine ligand-2 (CCL-2), and chemokine ligand-5 (CCL-5) are employed in the diagnostics, therapy, and prognosis of BC5. Abdominal obesity contributes to the creation of an environment that favors cancer growth6. Obesity has been linked to various cancers, including breast, endometrial, ovarian, thyroid, and prostate7.
Leptin, which is a 167 amino acid by-product of the human leptin gene, was discovered as a result of positional cloning of ob/ob mice, a mouse strain for obesity that was unintentionally identified at Jackson Laboratories8. These mice had a homozygous mutation of the leptin gene and showed infertility, hyperphagia, severe obesity, diabetes, neuroendocrine abnormalities, and considerable weight gain8.
Immunohistochemistry (IHC) was used to stain leptin in the cytoplasm of 83.7% of BC patients. Age, grade, histotype, disease stage, lymph node involvement, hormone receptor phenotype, and tumor recurrence are reported to be substantially linked with modest leptin immunostaining scores. ER-negative, PR-positive, and HER2-receptor phenotypes, as well as mucinous carcinomas, were reported to have a high degree of leptin immunoreactivity. Unfavorable survival has been associated with negative leptin immuno-staining results1.
This study was conducted with paired samples of invasive BC. Tissue samples (for immunohistochemistry (IHC) expression of leptin) and plasma samples (for estimation of leptin level by ELISA — concept of liquid biopsy) were used and associations between these and clinicopathological parameters were evaluated.
Methods
A laboratory observational cross-sectional study was performed in the department of pathology, in collaboration with the department of surgery, at a tertiary health care center in South India over 18 months (January 2021 to June 2022). The inclusion criterion was a new case of primary invasive ductal breast carcinoma diagnosed by fine needle aspiration cytology (FNAC) or trucut biopsy and confirmed by mastectomy specimen. The exclusion criteria were post-chemotherapy, post-radiotherapy, recurrent, male, secondary breast metastasis, other cancers, medication for hyperlipidemia, and pregnancy. A minimum sample size of 33 was calculated statistically using reference articles 9 and 10.
Ethical clearance for the study was obtained from the institutional ethics committee (IEC-571(a)/2020-21). Informed consent was obtained from all the study participants. Socio-demographic details of each case that were obtained from the case files or interactions with the patient included age, clinical presentation, and physical examination findings, including relevant laboratory and radiological investigations.
Following the FNAC or trucut diagnosis of BC and before the patient was subjected to surgery, 6 ml of blood was collected in a K2 EDTA vacutainer and centrifuged at 1500 rpm for 10 minutes. The plasma was separated and subjected to leptin estimation using an enzyme-linked immunosorbent assay (ELISA). The procedure followed the manufacturer’s protocol (Diagnostics Biochem Canada Inc.) and were expressed in ng/ml.
The mastectomy specimen was processed as per the standard operating procedure of the laboratory and the histopathological diagnosis of invasive BC was confirmed. The tissue sections of the tumor were subjected to IHC for leptin expression (GeneTex, Cat No. GTX109204, Rabbit polyclonal IgG antibody) using the manufacturer’s protocol with positive (tonsil) and negative controls.
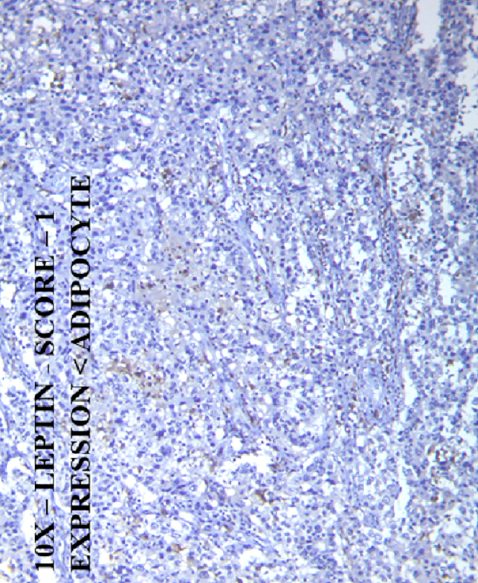
IHC scoring for leptin was as follows: Score 0 — negative expression, Score 1 — expression in tumor tissue less than that of a normal adipocyte, Score 2 — expression of tumor tissue equal to that of a normal adipocyte, and Score 3 — expression of tumor tissue greater than that of a normal adipocyte (Figure 1)9.

Data were entered into a Microsoft Excel 2007 spreadsheet and analyzed using IBM SPSS (Statistical Package for the Social Sciences) software version 22. Nominal data analyses were presented in numbers and percentages. Continuous data were expressed as means and standard deviations. Appropriate statistical tests were applied (chi-squared test) and a p-value < 0.05 was considered significant. Pearson’s correlation was performed to establish the relationships of the IHC leptin expression and plasma ELISA leptin levels.
| Basic characteristics | n | % | |
|---|---|---|---|
| Age category | 30 to 39 | 1 | 1.9% |
| 40 to 49 | 11 | 21.2% | |
| 50 to 59 | 22 | 42.3% | |
| 60 to 69 | 15 | 28.8% | |
| ≥ 70 | 3 | 5.8% | |
| Menopausal status | Pre-menopausal | 13 | 25.0% |
| Post-menopausal | 39 | 75.0% | |
| Parity | Multipara | 49 | 94.2% |
| Primipara | 3 | 5.8% | |
| BMI | Normal | 34 | 65.4% |
| Pre-obese | 4 | 7.7% | |
| Underweight | 14 | 26.9% | |
| Tumor infiltrating lymphocytes | No | 35 | 67.3% |
| Yes | 17 | 32.7% | |
| Lymphovascular invasion | No | 51 | 98.1% |
| Yes | 1 | 1.9% | |
| Tumour size | T1 | 13 | 25% |
| T2 | 35 | 67.3% | |
| T3 | 3 | 5.7% | |
| T4 | 1 | 1.9% | |
| Metastatic lymph nodes | No | 49 | 94.2% |
| Yes | 3 | 5.8% | |
| Distant metastasis | No | 52 | 100.0% |
| Staging | Stage I | 12 | 23% |
| Stage II | 39 | 75% | |
| Stage III | 1 | 1.9% | |
| Modified bloom Richardson grading | 1 | 10 | 19.2% |
| 2 | 24 | 46.1% | |
| 3 | 18 | 34.6% | |
| NPI | Moderate | 12 | 23.1% |
| Good | 40 | 76.9% | |
| ER | Negative | 29 | 55.8% |
| Positive | 23 | 44.2% | |
| PR | Negative | 31 | 59.6% |
| Positive | 21 | 40.4% | |
| HER2 NEU | Negative | 37 | 71.2% |
| Positive | 15 | 28.8% | |
| Ki67 | <14% | 22 | 42.3% |
| ≥14% | 30 | 57.7% | |
| IHC-Leptin Expression | ELISA -Leptin (ng/ml) | ||
|---|---|---|---|
| N (%) | Mean | Std. Deviation | |
| 0 | 4 (7.69%) | 19.58 | 6.83 |
| 1 | 6 (11.5%) | 48.98 | 18.93 |
| 2 | 20 (38.4%) | 41.96 | 20.10 |
| 3 | 22 (42.3%) | 41.65 | 20.30 |
| Total | 52 (100%) | 40.92 | 20.05 |
| p value | 0.1 | ||
| ELISA-Leptin | ||||||||||
|---|---|---|---|---|---|---|---|---|---|---|
| 0 | 1 | 2 | 3 | Mean (ng/ml) | SD | |||||
| n | % | n | % | n | % | n | % | |||
| Age category | ||||||||||
| 30 to 39 | 0 | 0.0% | 0 | 0.0% | 1 | 1.9% | 0 | 0.0% | 26.17 | |
| 40 to 49 | 0 | 0.0% | 2 | 3.8% | 5 | 9.6% | 4 | 7.7% | 37.96 | 18.21 |
| 50 to 59 | 1 | 1.9% | 2 | 3.8% | 9 | 17.3% | 10 | 19.2% | 46.01 | 19.64 |
| 60 to 69 | 2 | 3.8% | 1 | 1.9% | 4 | 7.7% | 8 | 15.4% | 37.98 | 21.55 |
| 70 and above | 1 | 1.9% | 1 | 1.9% | 1 | 1.9% | 0 | 0.0% | 34.06 | 26.77 |
| Total | 4 | 7.7% | 6 | 11.5% | 20 | 38.5% | 22 | 42.3% | 36.43 | 20.05 |
| Menopausal status | ||||||||||
| Pre-menopausal | 0 | 0.0% | 2 | 3.8% | 7 | 13.5% | 4 | 7.7% | 44.50 | 22.68 |
| Post-menopausal | 4 | 7.7% | 4 | 7.7% | 13 | 25.0% | 18 | 34.6% | 39.73 | 19.27 |
| Total | 4 | 7.7% | 6 | 11.5% | 20 | 38.5% | 22 | 42.3% | 40.92 | 20.05 |
| Parity | ||||||||||
| Multipara | 4 | 7.7% | 6 | 11.5% | 18 | 34.6% | 21 | 40.4% | 39.28 | 19.48 |
| Primipara | 0 | 0.0% | 0 | 0.0% | 2 | 3.8% | 1 | 1.9% | 67.63 | 3.33 |
| Total | 4 | 7.7% | 6 | 11.5% | 20 | 38.5% | 22 | 42.3% | 40.92 | 20.05 |
| BMI | ||||||||||
| Normal | 3 | 5.8% | 2 | 3.8% | 13 | 25.0% | 16 | 30.8% | 42.14 | 20.87 |
| Pre-obese | 0 | 0.0% | 1 | 1.9% | 2 | 3.8% | 1 | 1.9% | 38.81 | 20.35 |
| Underweight | 1 | 1.9% | 3 | 5.8% | 5 | 9.6% | 5 | 9.6% | 38.54 | 19.08 |
| Total | 4 | 7.7% | 6 | 11.5% | 20 | 38.5% | 22 | 42.3% | 40.92 | 20.05 |
| IHC Leptin Expression Score | ELISA -Leptin | |||||||||
| 0 | 1 | 2 | 3 | Mean (ng/ml) | SD | |||||
| N | % | N | % | N | % | N | % | |||
| Tumor Infiltrating Lymphocytes (TIL) | ||||||||||
| No | 1 | 1.9% | 6 | 11.5% | 14 | 26.9% | 14 | 26.9% | 38.97 | 18.07 |
| Positive | 3 | 5.8% | 0 | 0.0% | 6 | 11.5% | 8 | 15.4% | 44.94 | 23.71 |
| Total | 4 | 7.7% | 6 | 11.5% | 20 | 38.5% | 22 | 42.3% | 40.92 | 20.05 |
| Lymphovascular Invasion (LVI) | ||||||||||
| No | 4 | 7.7% | 6 | 11.5% | 20 | 38.5% | 21 | 40.4% | 40.56 | 20.08 |
| Positive | 0 | 0.0% | 0 | 0.0% | 0 | 0.0% | 1 | 1.9% | 59.42 | 23.5 |
| Total | 4 | 7.7% | 6 | 11.5% | 20 | 38.5% | 22 | 42.3% | 40.92 | 20.05 |
| IHC Leptin Expression Score | ELISA -Leptin | |||||||||
| 0 | 1 | 2 | 3 | Mean (ng/ml) | SD | |||||
| n | % | n | % | n | % | n | % | |||
| Tumor size | ||||||||||
| T1 | 1 | 1.9% | 2 | 3.8% | 7 | 13.5% | 3 | 5.8% | 41.58 | 21.46 |
| T2 | 2 | 3.8% | 2 | 3.8% | 12 | 23.1% | 19 | 36.5% | 39.80 | 19.89 |
| T3 | 1 | 1.9% | 1 | 1.9% | 1 | 1.9% | 0 | 0.0% | 45.86 | 24.04 |
| T4 | 0 | 0.0% | 1 | 1.9% | 0 | 0.0% | 0 | 0.0% | 56.75 | 23.5 |
| Total | 4 | 7.7% | 6 | 11.5% | 20 | 38.5% | 22 | 42.3% | 40.92 | 20.05 |
| Metastatic lymph nodes | ||||||||||
| No | 4 | 7.7% | 6 | 11.5% | 20 | 38.5% | 19 | 36.5% | 41.17 | 20.32 |
| Positive | 0 | 0.0% | 0 | 0.0% | 0 | 0.0% | 3 | 5.8% | 36.74 | 17.66 |
| Total | 4 | 7.7% | 6 | 11.5% | 20 | 38.5% | 22 | 42.3% | 40.92 | 20.05 |
| Stage | ||||||||||
| I | 1 | 1.9% | 2 | 3.8% | 7 | 13.5% | 2 | 3.8% | 43.35 | 21.40 |
| II | 3 | 5.8% | 3 | 5.8% | 13 | 25.0% | 20 | 38.5% | 39.76 | 19.93 |
| III | 0 | 0.0% | 1 | 1.9% | 0 | 0.0% | 0 | 0.0% | 56.75 | 23.5 |
| Total | 4 | 7.7% | 6 | 11.5% | 20 | 38.5% | 22 | 42.3% | 40.92 | 20.05 |
| Modified Bloom Richardson Grading | IHC Leptin Expression Score | ELISA -Leptin | ||||||||
| 0 | 1 | 2 | 3 | Mean (ng/ml) | SD | |||||
| n | % | n | % | n | % | n | % | |||
| 1 | 0 | 0.0% | 1 | 1.9% | 6 | 11.5% | 3 | 5.8% | 41.15 | 19.72 |
| 2 | 2 | 3.8% | 4 | 7.7% | 9 | 17.3% | 9 | 17.3% | 40.60 | 23.05 |
| 3 | 2 | 3.8% | 1 | 1.9% | 5 | 9.6% | 10 | 19.2% | 41.21 | 16.77 |
| Total | 4 | 7.7% | 6 | 11.5% | 20 | 38.5% | 22 | 42.3% | 40.92 | 20.05 |
| p value | 0.5 | 0.9 | ||||||||
| NPI Prognostic Score | IHC Leptin Expression Score | ELISA -Leptin | ||||||||
| 0 | 1 | 2 | 3 | Mean (ng/ml) | SD | |||||
| n | % | n | % | n | % | n | % | |||
| Good | 3 | 5.8% | 4 | 7.7% | 16 | 30.8% | 17 | 32.7% | 39.61 | 18.99 |
| Moderate | 1 | 1.9% | 2 | 3.8% | 4 | 7.7% | 5 | 9.6% | 45.27 | 23.63 |
| Total | 4 | 7.7% | 6 | 11.5% | 20 | 38.5% | 22 | 42.3% | 40.92 | 20.05 |
| p value | 0.9 | 0.3 | ||||||||
| IHC Leptin Expression Score | ELISA-Leptin | |||||||||
| 0 | 1 | 2 | 3 | Mean (ng/ml) | SD | |||||
| N | % | N | % | N | % | N | % | |||
| ER Expression | ||||||||||
| Negative | 4 | 7.7% | 2 | 3.8% | 10 | 19.2% | 13 | 25.0% | 34.80 | 16.66 |
| Positive | 0 | 0.0% | 4 | 7.7% | 10 | 19.2% | 9 | 17.3% | 48.64 | 21.61 |
| Total | 4 | 7.7% | 6 | 11.5% | 20 | 38.5% | 22 | 42.3% | 40.92 | 20.05 |
| PR Expression | ||||||||||
| Negative | 4 | 7.7% | 2 | 3.8% | 10 | 19.2% | 15 | 28.8% | 34.71 | 16.42 |
| Positive | 0 | 0.0% | 4 | 7.7% | 10 | 19.2% | 7 | 13.5% | 50.08 | 21.75 |
| Total | 4 | 7.7% | 6 | 11.5% | 20 | 38.5% | 22 | 42.3% | 40.92 | 20.05 |
| HER2 Neu Expression | ||||||||||
| Negative | 2 | 3.8% | 4 | 7.7% | 15 | 28.8% | 16 | 30.8% | 40.59 | 18.73 |
| Positive | 2 | 3.8% | 2 | 3.8% | 5 | 9.6% | 6 | 11.5% | 41.73 | 23.69 |
| Total | 4 | 7.7% | 6 | 11.5% | 20 | 38.5% | 22 | 42.3% | 40.92 | 20.05 |
| Ki67 Expression | ||||||||||
| <14% | 0 | 0.0% | 3 | 5.8% | 10 | 19.2% | 9 | 17.3% | 44.43 | 19.69 |
| >14% | 4 | 7.7% | 3 | 5.8% | 10 | 19.2% | 13 | 25.0% | 38.34 | 20.25 |
| Total | 4 | 7.7% | 6 | 11.5% | 20 | 38.5% | 22 | 42.3% | 40.92 | 20.05 |
| Molecular Classification | n (%) | IHC Leptin Expression Score | ELISA-Leptin | ||||
| 0 | 1 | 2 | 3 | Mean (ng/ml) | SD | ||
| Luminal – A | 9 (17.3%) | - | 1 | 5 | 3 | 33.6 | 19.5 |
| Luminal – B | 14 (26.9%) | - | 3 | 5 | 6 | 48.3 | 22.7 |
| HER2 Neu Enriched | 9 (17.3%) | 2 | 1 | 3 | 3 | 48.8 | 21.7 |
| Triple Negative | 20 (38.4%) | 2 | 1 | 7 | 10 | 35.3 | 15.8 |
| Total | 52 (100%) | 4 | 6 | 20 | 22 | 40.9 | 20.1 |
| p value | 0.558 | 0.1 | |||||
Results
In the present study, 52 cases of BC were considered. The basic data of the patients are shown in Table 1, and 92.3% of cases showed IHC leptin positivity. The plasma leptin levels ranged from 13.21 – 79.54 ng/ml with a mean of 40.92 ± 20.05 ng/ml. The association between IHC leptin score and plasma ELISA leptin levels was weak and not significant (Table 2).
The age distribution ranged from 35 - 75 years with a mean of 56.29 ± 9.03 years. The maximum number of cases (42.3%) were observed in patients between 50 and 59 years of age. The maximum IHC leptin expression and mean maximum plasma ELISA leptin levels (46.01 ± 19.64 ng/ml) were observed in the 50 – 59 age group. The association of IHC leptin score and plasma ELISA leptin level with age was not statistically significant (Table 3).
Of the cases studied, 75% were in the post-menopausal group, and the IHC leptin score was dominant in this group. ELISA leptin was highest (44.50 ± 22.68 ng/ml) in pre-menopausal women. The association of IHC leptin score and plasma ELISA leptin levels with menopausal status was not statistically significant (Table 3).
Parity among the cases studied ranged from 1-5 with a mean of 2.56±0.98. Multiparous women showed the highest IHC leptin expression, while primiparous patients showed the greatest plasma ELISA expression (67.63 ± 3.33 ng/ml). The association of parity with IHC leptin was not statistically significant, although the parity and plasma ELISA leptin correlation was statistically significant (Table 3).
The BMI in the present study ranged from 17 - 26 with a mean of 19.96 ± 2.12. The majority of cases (65.4%) had normal BMIs (Table 1). IHC leptin expression and plasma ELISA leptin (42.14 ± 20.87 ng/ml) were highest among those with normal BMI levels. The association of IHC leptin score and plasma ELISA leptin levels with BMI was not statistically significant (Table 3).
Among the cases studied, 67.3% did not show tumor-infiltrating lymphocytes (TIL) in the tumor tissue and IHC leptin was maximum among these cases, whereas plasma ELISA leptin levels were maximum (44.94 ± 23.71 ng/ml) in cases with TIL. The association of IHC leptin score and plasma ELISA leptin levels with TIL was not statistically significant (Table 4).
Lymphovascular invasion (LVI) was absent in 98% of the cases, and IHC leptin expression was predominant among these. Plasma ELISA leptin levels were the highest (59.42 ± 23.5 ng/ml) among cases with positive LVIs. The association of IHC leptin score and plasma ELISA leptin levels with LVI was not statistically significant (Table 4).
Regarding the size of the tumor, 67.3% of cases were in T2 with an IHC leptin score of 3 showing a statistically significant predominance. Mean plasma ELISA leptin levels were highest in the T4 group (56.75 ± 23.5 ng/ml), although the results were not statistically significant. Regarding the lymph node involvement, 94.2% of cases did not present with metastatic lymph nodes but showed maximum IHC leptin expression and maximum plasma ELISA leptin levels compared to the metastatic group. The association was not statistically significant. The majority of the cases were in Stage 2 (75%) and Stage 1 (23%). Only a single Stage 3 case was noted. IHC Leptin expression was greatest in Stage 2 and the association was statistically significant. Plasma ELISA leptin levels were high (43.35 ± 21.40 ng/ml) among the Stage 1 group and were not statistically significant (Table 5).
Among the cases studied, 46.1% had a modified bloom Richardson Grade 2 and showed maximum IHC leptin expression that was not statistically significant. Plasma ELISA leptin levels were maximum among Grade 3 cases (41.21 ± 16.77 ng/ml) but were not statistically significant (Table 6).
Regarding Nottingham prognostic index (NPI) scoring, 76.9% and 23.1% of cases had good and moderate prognostic indexes, respectively. Cases with good prognostic indexes had maximum IHC leptin expressions that were not statistically significant. Plasma ELISA leptin levels were highest (45.27 ± 23.63 ng/ml) among the moderate prognostic group, although they were not statistically significant (Table 7).
Estrogen receptor (ER) positive and negative cases were 44.2% and 55.8%, respectively. Cases with positive expression for IHC expression for ER showed maximum IHC leptin expression; however, it was not statistically significant. The cases with positive and negative IHC expression for ER showed mean plasma ELISA leptin values of 48.64 ± 20.05 ng/ml and 34.80 ± 16.66 ng/ml, respectively, which were statistically significant (Table 8).
Progesterone receptor (PR) positive and negative cases were 40.4% and 59.6%, respectively. Cases with negative PR expression showed maximum IHC leptin with no statistical significance. Cases with positive and negative IHC expression for PR showed mean plasma ELISA leptin values of 50.08 ± 21.75 ng/ml and 34.71 ± 16.42 ng/ml, respectively, and the values were statistically significant (Table 8).
HER2 Neu positive and negative cases were 28.8% and 71.2% respectively. Cases with negative HER2 Neu expression showed maximum IHC leptin expression. Plasma ELISA leptin was highest (41.73 ± 23.69 ng/ml) among cases with positive HER2 Neu expression. The association of IHC leptin score and plasma ELISA leptin levels with HER2 Neu expression was not statistically significant (Table 8).
Values of Ki 67 <14% and >14% were 42.3% and 57.7%, respectively. Cases with >14% IHC expression of Ki67 showed maximum expression; however, they were not statistically significant. Cases with <14% and >14% IHC expression for Ki67 showed mean plasma ELISA leptin values of 44.43 ± 19.69 ng/ml and 38.34 ± 20.25 ng/ml, respectively, and the values were not statistically significant (Table 8).
Luminal A, luminal B, Her2 enriched, and triple-negative were 17.3%, 26.9%, 17.3%, and 38.4% respectively. Cases with triple-negative categories showed maximum IHC leptin score expressions when compared with the other categories and the results were not statistically significant. The mean plasma ELISA leptin levels in luminal A, luminal B, Her2 Neu, and triple-negative categories were 48.3 ± 22.7 ng/ml, 48.8 ± 21.7 ng/ml, 33.6 ± 19.5 ng/ml, and 35.3 ± 15.8 ng/ml respectively, although the values were not statistically significant (Table 9).
Discussion
The most important marker in the relationship between breast cancer and obesity is leptin, which induces the initiation, development, growth, and spread of tumors10, 11. Through its interactions with other molecules for signaling such as Notch, growth factors, ER, and inflammatory factors, leptin increases the risk of breast cancer12. Studies have reported the role of plasma leptin and IHC leptin in breast cancer prognoses; however, only a few research reports have provided further insight. Therefore, the objective of the current study was to ascertain an association between the plasma ELISA leptin levels of BC patients and the IHC leptin expression in tissue sections.
The human body synthesizes leptin, a particular type of hormone, to participate in a number of physiological and biochemical activities. Previous research has shown that human disorders such as cardiovascular disorders and fatty liver disease (non-alcoholic) typically develop in conjunction with elevated leptin expression levels13, 14. Angiogenesis, reproduction, the immune system, energy balance, hunger regulation, and bone growth are impacted by the pleiotropic molecule leptin. The proliferation of other cell types, including breast cells, is also impacted by leptin15, 16.
In the present study, IHC revealed that 92.3% and 7.6% of the cases had positive and negative leptin expressions, respectively. Among these, 11.5%, 38.4%, and 43.3% showed Score 1, 2, and 3 leptin positivities, respectively. Similar results have been reported in other studies by Khabaz MN et al., Ishikawa M et al., and Atalay Karacay I et al., in which the positive expression of leptin was 83.7%, 100%, and 75.6%, respectively1, 17, 18. This suggests that the adipokine marker leptin has a major role in tumorigenesis and BC progression19, 20, 21, 22. In the present study, the range of plasma ELISA leptin levels was 13.2-79.54 ng/ml, with a mean of 40.92 ± 20.05 ng/ml. In a study by Tayel S.I et al., the mean plasma ELISA leptin concentration was 19.81 ± 8.9123. Leptin values depend on various parameters such as BMI, family history, and lifestyle habits. The mean plasma ELISA leptin values are high in the present study compared to those reported by Tayel S.I et al.23. The reasons for this variation could be different diet habits, lack of physical activity, family history, or different test kits used to measure plasma leptin levels in the study subjects. No correlation between blood leptin levels and BC development has been reported in other studies24, 25. In the present research, the correlation of plasma ELISA leptin with IHC leptin levels was not significant.
In the present study, the maximum expression of IHC leptin was noted in the age group of 50 – 59 years. Similarly, Khabaz MN et al. determined that the age group of 50 – 59 showed a high expression of leptin with a statistically significant p-value1. In the present study, the plasma ELISA leptin was highest among the 50 to 59 age group, with a mean concentration of 46.01 ± 19.64 that was not statistically significant. Similarly, in the study by Tayel S.I et al., the mean plasma ELISA leptin level (mean age 48.55 ± 10.96) was not statistically significant23. The reason for this age group showing the highest numbers could be due to hormonal changes which begin in the peri/post-menopausal age group, as well as stress-related factors, lack of physical activity, and possibly the changing of food habits23.
In the present study, the majority (75%) of the cases were in the postmenopausal group and IHC leptin was the highest in this group, but the results were not statistically significant. To our knowledge, no English-language study is available that compares menopausal status among patients with IHC leptin expression. In the present study, plasma ELISA leptin values were higher in premenopausal women, with a mean value of 44.5 ± 22.68 ng/ml; however, the results were not statistically significant. In a study by Tayel S.I et al., the majority of cases with high leptin values in the plasma were in the postmenopausal category, and those results are in concordance with our study23. Studies by Harris HR et al. and Hu X et al. revealed a negative correlation between the levels of leptin in the blood and the incidence of BC in premenopausal women26.
In the present study, the highest number of cases occurred in multiparous women (94.2%). IHC leptin was greatest in multiparous women, but the results were not statistically significant. To our knowledge, no study is available to compare these parities among patients with immunohistochemistry leptin expression. The plasma ELISA leptin levels were significantly elevated in primiparous women, with a mean concentration of 67.63 ± 3.33, which was statistically significant. In the study by Tayel S.I et al., the majority of the patients were multiparous (95%) and the p-value for leptin levels was not significant23.
The mean BMI value in the current study was 19.96±2.12 (kg/m2). The BMIs in the present study were divided into underweight, normal, and pre-obese categories, with 65.3% of study the population in the normal BMI range. Normal BMI cases showed maximum IHC expression that was not statistically significant. To our knowledge, no study is available to compare BMI values among patients with IHC leptin expression. ELISA leptin was highest in normal BMI patients, with an average concentration of 42.14 ± 20.87 ng/ml and no statistical significance. In a study by Tayel S.I et al., the mean BMI value among breast cancer patients was 28.63±3.87 (kg/m2) and the results were statistically significant when compared with the leptin values23. The differences relate to different lifestyles, diet habits, and socioeconomic statuses of the study population.
In the present study, most cases (67.3%) did not have TIL but showed maximum IHC leptin expression. Plasma ELISA leptin levels were high among positive TIL cases. The results obtained for both IHC and ELISA values were not statistically significant. To our knowledge, there is no published study available to compare TIL status of tumors with IHC leptin expression and plasma Elisa leptin values.
In the current study, the majority of cases (98%) showed no LVI but maximum IHC leptin expression, although the values were not statistically significant. Studies by Khabaz MN et al., Atalay Karacay I et al., and Ishikawa M et al. showed similar results for IHC leptin expression in cases with no LVI, but they were not statistically significant1, 17, 18. Plasma ELISA leptin levels were high when positive LVI values existed in the present study, but the results were not statistically significant. To our knowledge, there is no published study to compare the LVI status of tumors with plasma Elisa leptin values.
Our study revealed that most cases (67.3%) were of the pT2 category and showed high IHC leptin expressions that were statistically significant. In studies by Khabaz MN et al. and Ishikawa M et al., where the majority of cases were of the pT2 category, the association of IHC leptin expression and tumor size was not statistically significant1, 17. Plasma ELISA leptin levels were the highest among T4 tumors in the present study, with a mean of 56.75 ± 23.5 ng/ml, but the results were not statistically significant. To our knowledge, no study is available to compare the pT size of tumors among breast cancer patients with plasma ELISA leptin values.
In this study, most of the study population (94.2%) did not show metastatic lymph nodes but had maximum IHC leptin expression that was not statistically significant. Plasma ELISA leptin was high among the non-metastatic study population and the results were not statistically significant. To our knowledge, there is no available published study to compare the pN nodal status of tumors with IHC leptin expression and plasma ELISA leptin values.
The greatest number of patients (75%) belonged to Stage 2 and showed high expression of IHC leptin with statistical significance. Similar results were published in a study by Khabaz MN et al. regarding the stage of the disease and IHC leptin expression, and statistical significance was found1. In studies by Ishikawa M et al. and Atalay Karacay I et al. using similar populations, the results were not statistically significant17, 18. Plasma ELISA leptin levels were high among the Stage 1 group of the present study population and the results were not statistically significant. To our knowledge, no study is available to compare pTNM staging among breast cancer patients with Elisa leptin values.
The majority of the study subjects (46.1%) were in Grade 2 of the modified Bloom Richardson grading system and showed high leptin expression with scores of 2 and 3. ELISA leptin was high among the population belonging to Grade 2 and Grade 3. The results obtained were not statistically significant. To our knowledge, no study is available to compare modified Bloom Richardson grading among breast cancer patients with IHC leptin expression and ELISA leptin values.
In this study, most of the study population had good prognostic indexes according to the NPI scoring system, with maximum IHC leptin scores. ELISA leptin was high among the moderate prognostic index study population according to the NPI scoring system. The results obtained were not statistically significant. To our knowledge, no study is available to compare NPIs among breast cancer patients with IHC leptin expression and Elisa leptin values.
The maximum number of the study population showing ER negative expressions was 55.7%, which contrasts the studies of Khabaz MN et al., Atalay Karacay I et al., and Ishikawa M et al., in which the highest number of subjects showed ER positivity1, 17, 18. The ER negative subjects in the present study had strong IHC leptin expressions with scores of 2 and 3, but the values were not statistically significant. Similar results were reported in studies by Khabaz MN et al., Atalay Karacay I et al., and Ishikawa M et al., and the results were statistically significant1, 17, 18. The plasma ELISA leptin levels were highest in the ER positive cases and were statistically significant. To our knowledge, no study is available to compare IHC ER expression levels among breast cancer patients with ELISA leptin values.
In this study, the maximum percentage of the study population that showed PR negative expression was 59.6%, which contrasted the studies of Khabaz MN et al., Atalay Karacay I et al., and Ishikawa M et al., in which the majority of patients were PR positive1, 17, 18. The PR negative subjects in our study showed strong IHC leptin expression with scores of 2 and 3, but the values were not statistically significant. Similar results were noted by Khabaz MN et al., Atalay Karacay I et al., and Ishikawa M et al.1, 17, 18. The plasma ELISA leptin levels were the highest in PR positive cases and were statistically significant. To our knowledge, no study is available to compare IHC PR expression among breast cancer patients with ELISA leptin values.
There was no statistically significant association of IHC HER2 Neu receptor expression, Ki67 expression, or molecular types with IHC leptin expression and plasma ELISA leptin values. To our knowledge, there are no published studies available to compare these parameters.
The limitations of the present study were the small sample size, unicentric focus, and the lack of a control group for comparison with BC cases. However, among the study population with paired samples of tissue and plasma, 92.3% of cases showed IHC leptin positivity which can be used for adjuvant-targeted chemotherapy. Plasma leptin levels ranged from 13.21 - 79.54 ng/ml with a mean of 40.92 ± 20.05 ng/ml. This information can be used as a baseline for BC in further case studies in larger populations to derive a cut-off value, which can be used as a screening tool for the prevention or early detection of BC. The association of IHC leptin expression and plasma leptin levels was not statistically significant. Among various clinicopathological parameters studied, the association of IHC leptin expression in relation to the size (p-value 0.04) and stage (p-value 0.05) of tumors was statistically significant. Plasma ELISA leptin levels in relation to parity (p-value 0.04), estrogen (p-value 0.01), and progesterone (p-value 0.005) receptors were statistically significant.
Conclusions
In 92.3% of the cases, IHC leptin positivity was identified. The mean plasma ELISA leptin level was 40.92 ± 20.05 ng/ml. IHC leptin expression had a statistically significant association with the size and stage of the tumor. Plasma ELISA leptin levels had statistically significant associations with parity, estrogen, and progesterone receptors.
Abbreviations
BC: Breast cancer, BMI: Body mass index, CCL-2: Chemokine ligand-2, CCL-5: Chemokine ligand-5, ELISA: Enzyme linked immunosorbent assay, ER: Estrogen Receptor, FNAC: Fine needle aspiration cytology, H&E: Haematoxylin and Eosin, Her 2: Human epidermal growth factor receptor 2, IHC: ImmunohistochemistryIL-6: Interleukin-6, K2 EDTA: Dipotassium ethylenediaminetetraacetic acid, LVI: Lymphovascular invasion, NPI: Nottingham Prognostic index, PR: Progesterone Receptor, SPSS: Statistical Package for the Social Sciences, TIL: Tumour infiltrating lymphocytes
Acknowledgments
None.
Author’s contributions
Jahnavi Reddy Yeduguri: Data collection, literature search, statistical analysis, Manuscript writing; Kalyani Raju: Concept, literature search, manuscript writing, manuscript editing, manuscript reviewing; Sreeramulu Patrapalli Nadipanna: Data collection, manuscript reviewing. All authors read and approved the final manuscript.
Funding
None.
Availability of data and materials
Data and materials used and/or analyzed during the current study are available from the corresponding author on reasonable request.
Ethics approval and consent to participate
This study was conducted in accordance with the amended Declaration of Helsinki. The institutional review board approved the study (IEC-571(a)/2020-21), and all participants provided written informed consent.
Consent for publication
Not applicable.
Competing interests
The authors declare that they have no competing interests.
References
-
Khabaz
M.N.,
Abdelrahman
A.,
Butt
N.,
Damnhory
L.,
Elshal
M.,
Aldahlawi
A.M.,
Immunohistochemical staining of leptin is associated with grade, stage, lymph node involvement, recurrence, and hormone receptor phenotypes in breast cancer. BMC Women's Health.
2017;
17
(1)
:
105
.
View Article PubMed Google Scholar -
Bray
F.,
Ferlay
J.,
Soerjomataram
I.,
Siegel
R.L.,
Torre
L.A.,
Jemal
A.,
Global cancer statistics 2018: GLOBOCAN estimates of incidence and mortality worldwide for 36 cancers in 185 countries. CA: a Cancer Journal for Clinicians.
2018;
68
(6)
:
394-424
.
View Article PubMed Google Scholar -
Malvia
S.,
Bagadi
S.A.,
Dubey
U.S.,
Saxena
S.,
Epidemiology of breast cancer in Indian women. Asia Pacific Journal of Clinical Oncology.
2017;
13
(4)
:
289-95
.
View Article PubMed Google Scholar -
Kalyani
R.,
Das
S.,
Bindra Singh
M.S.,
Kumar
H.,
Cancer profile in the Department of Pathology of Sri Devaraj Urs Medical College, Kolar: a ten years study. Indian Journal of Cancer.
2010;
47
(2)
:
160-5
.
View Article PubMed Google Scholar -
Zhao
C.,
Wu
M.,
Zeng
N.,
Xiong
M.,
Hu
W.,
Lv
W.,
Cancer-associated adipocytes: emerging supporters in breast cancer. Journal of Experimental & Clinical Cancer Research.
2020;
39
(1)
:
156
.
View Article PubMed Google Scholar -
Chang
H.H.,
Eibl
G.,
Obesity-induced adipose tissue inflammation as a strong promotional factor for pancreatic ductal adenocarcinoma. Cells.
2019;
8
(7)
:
673
.
View Article PubMed Google Scholar -
Gallagher
E.J.,
LeRoith
D.,
Obesity and diabetes: the increased risk of cancer and cancer-related mortality. Physiological Reviews.
2015;
95
(3)
:
727-48
.
View Article PubMed Google Scholar -
Zhang
Y.,
Proenca
R.,
Maffei
M.,
Barone
M.,
Leopold
L.,
Friedman
J.M.,
Positional cloning of the mouse obese gene and its human homologue. Nature.
1994;
372
(6505)
:
425-32
.
View Article PubMed Google Scholar -
Ishikawa
M.,
Kitayama
J.,
Nagawa
H.,
Enhanced expression of leptin and leptin receptor (OB-R) in human breast cancer. Clinical Cancer Research.
2004;
10
(13)
:
4325-31
.
View Article PubMed Google Scholar -
Hajati
A.,
Talebian
F.,
Babahajian
A.,
Daneshkhah
N.,
Ghaderi
B.,
Association of serum Leptin with prognostic factors in breast cancer. Sudan Journal of Medical Sciences.
2022;
17
(1)
:
4-14
.
View Article Google Scholar -
Barone
I.,
Giordano
C.,
Bonofiglio
D.,
Andò
S.,
Catalano
S.,
Leptin, obesity and breast cancer: progress to understanding the molecular connections. Current Opinion in Pharmacology.
2016;
31
:
83-9
.
View Article PubMed Google Scholar -
Newman
G.,
Gonzalez-Perez
R.R.,
Leptin-cytokine crosstalk in breast cancer. Molecular and Cellular Endocrinology.
2014;
382
(1)
:
570-82
.
View Article PubMed Google Scholar -
Wallace
A.M.,
McMahon
A.D.,
Packard
C.J.,
Kelly
A.,
Shepherd
J.,
Gaw
A.,
Plasma leptin and the risk of cardiovascular disease in the west of Scotland coronary prevention study (WOSCOPS). Circulation.
2001;
104
(25)
:
3052-6
.
View Article PubMed Google Scholar -
Polyzos
S.A.,
Aronis
K.N.,
Kountouras
J.,
Raptis
D.D.,
Vasiloglou
M.F.,
Mantzoros
C.S.,
Circulating leptin in non-alcoholic fatty liver disease: a systematic review and meta-analysis. Diabetologia.
2016;
59
(1)
:
30-43
.
View Article PubMed Google Scholar -
Jardé
T.,
Perrier
S.,
Vasson
M.P.,
Caldefie-Chézet
F.,
Molecular mechanisms of leptin and adiponectin in breast cancer. European Journal of Cancer (Oxford, England).
2011;
47
(1)
:
33-43
.
View Article PubMed Google Scholar -
Andò
S.,
Barone
I.,
Giordano
C.,
Bonofiglio
D.,
Catalano
S.,
The multifaceted mechanism of Leptin signaling within tumor microenvironment in driving breast cancer growth and progression. Frontiers in Oncology.
2014;
4
:
340
.
PubMed Google Scholar -
Ishikawa
M.,
Kitayama
J.,
Nagawa
H.,
Enhanced expression of leptin and leptin receptor (OB-R) in human breast cancer. Clinical Cancer Research.
2004;
10
(13)
:
4325-31
.
View Article PubMed Google Scholar -
Atalay Karacay
I.,
Sezgin Alikanoglu
A.,
Suren
D.,
Ozturk
B.,
Karakas
B.R.,
Sezer
C.,
Leptin and leptin receptor expression in breast carcinomas and their relationship with clinicopathological features. Human Pathology Reports..
2022;
30
:
30-67
.
View Article Google Scholar -
El-Hussiny
M.A.,
Atwa
M.A.,
Rashad
W.E.,
Shaheen
D.A.,
Elkady
N.M.,
Leptin receptor Q223R polymorphism in Egyptian female patients with breast cancer. Contemporary Oncology (Poznan, Poland).
2017;
21
(1)
:
42-7
.
View Article PubMed Google Scholar -
Mohammadzadeh
G.,
Ghaffari
M.A.,
Bafandeh
A.,
Hosseini
S.M.,
Ahmadi
B.,
The relationship between -2548G/A leptin gene polymorphism and risk of breast cancer and serum leptin levels in Ahvazian women. Iranian Journal of Cancer Prevention.
2015;
8
(2)
:
100-8
.
PubMed Google Scholar -
Romero-Figueroa
M.S.,
Garduño-García
J.J.,
Duarte-Mote
J.,
Matute-González
G.,
Gómez-Villanueva
A.,
De la Cruz-Vargas
J.,
Insulin and leptin levels in obese patients with and without breast cancer. Clinical Breast Cancer.
2013;
13
(6)
:
482-5
.
View Article PubMed Google Scholar -
Awadhi
S.A. Al,
Khaldi
R.M. Al,
Rammah
T. Al,
Kapila
K.,
Mojiminiyi
O.A.,
Associations of adipokines & insulin resistance with sex steroids in patients with breast cancer. The Indian Journal of Medical Research.
2012;
135
(4)
:
500-5
.
PubMed Google Scholar -
Tayel
S.I.,
Alhanafy
A.M.,
Ahmed
S.M.,
Eltorgoman
A.A.,
Elsayed
I.E.,
Biochemical study on modifying role of variants of leptin gene and its receptor on serum leptin levels in breast cancer. Molecular Biology Reports.
2020;
47
(5)
:
3807-20
.
View Article PubMed Google Scholar -
Gu
F.,
Kraft
P.,
Rice
M.,
Michels
K.B.,
Leptin and leptin receptor genes in relation to premenopausal breast cancer incidence and grade in Caucasian women. Breast Cancer Research and Treatment.
2012;
131
(1)
:
17-25
.
View Article PubMed Google Scholar -
Aliustaoglu
M.,
Bilici
A.,
Gumus
M.,
Colak
A.T.,
Baloglu
G.,
Irmak
R.,
Preoperative serum leptin levels in patients with breast cancer. Medical Oncology (Northwood, London, England).
2010;
27
(2)
:
388-91
.
View Article PubMed Google Scholar -
Harris
H.R.,
Tworoger
S.S.,
Hankinson
S.E.,
Rosner
B.A.,
Michels
K.B.,
Plasma leptin levels and risk of breast cancer in premenopausal women. Cancer Prevention Research (Philadelphia, Pa.).
2011;
4
(9)
:
1449-56
.
View Article PubMed Google Scholar
Comments
Article Details
Volume & Issue : Vol 10 No 3 (2023)
Page No.: 5596-5608
Published on: 2023-03-31
Citations
Copyrights & License
This work is licensed under a Creative Commons Attribution 4.0 International License.
Search Panel
Pubmed
Google Scholar
Pubmed
Google Scholar
Pubmed
Search for this article in:
Google Scholar
Researchgate
- HTML viewed - 4661 times
- PDF downloaded - 1124 times
- XML downloaded - 121 times
