

Copyrights: Nandita Ghosh, Shinjini Mitra, Ena Ray Banerjee, 2022. License: This work is licensed under a Creative Commons Attribution 4.0 International License.
Abstract
Introduction: Rheumatoid arthritis (RA) is a bone disorder causing inflammation of synovial lining followed by production of proinflammatory cytokines at the same site. The synovial hyperplasia is also mediated by the infiltration of lymphocytes, macrophages and other inflammatory cells. The available drugs for RA shows temporary recovery and some are associated with side effects. Here we have used surface functionalized guar gum nanoparticles (GN) to ameliorate disease pathology using collagen II (CII) induced arthritis model in C57BL/6 mice.
Methods: The systemic as well as the bone damage was assessed by the total count, differential count, clonogenic potential, flow cytometry and histological studies. The migration of inflammatory cells was assessed by flow cytometry of cells from the bone marrow, blood, spleen and the synovial tissue. The joint inflammation was assessed both by visible presentation in terms of thickness and corroborated with the H&E staining of the knee joint sections.
Results: Synovitis was observed in the diseased group while GN controlled the synovial inflammation. Post sacrifice, the total number of cells and the immune cells were increased significantly in the diseased group and decreased on GN treatment. The clonogenic potential of cells was also restored on GN administration. The elevated level of NO was also decreased by GN administration. The expression of proinflammatory cytokines and the signaling molecules were also restored on GN treatment.
Conclusion: The results provide insights to understand the therapeutic effect of GN in CII induced arthritis for translational outcomes. Through this study we investigated the signaling mechanism involved in the pathology of disease to examine the role of GN in preventing the disease progression.
Introduction
Rheumatoid arthritis (RA) is a complex autoimmune disease associated with joint inflammation 1, 2. The complexity of the disease is associated with the involvement of immune cells, osteoclasts, synovial cells, and other cells3. The immune cells in the subchondral bone marrow (BM) also play important role in disease pathogenesis3. RA is associated with synovial hyperplasia, increased volume of synovial fluid, and increased infiltration of certain cells, including fibroblasts, macrophages, neutrophils, T cells, and dendritic cells, into the synovium1, 2. These infiltrating inflammatory cells mainly mediate bone and cartilage damage1.
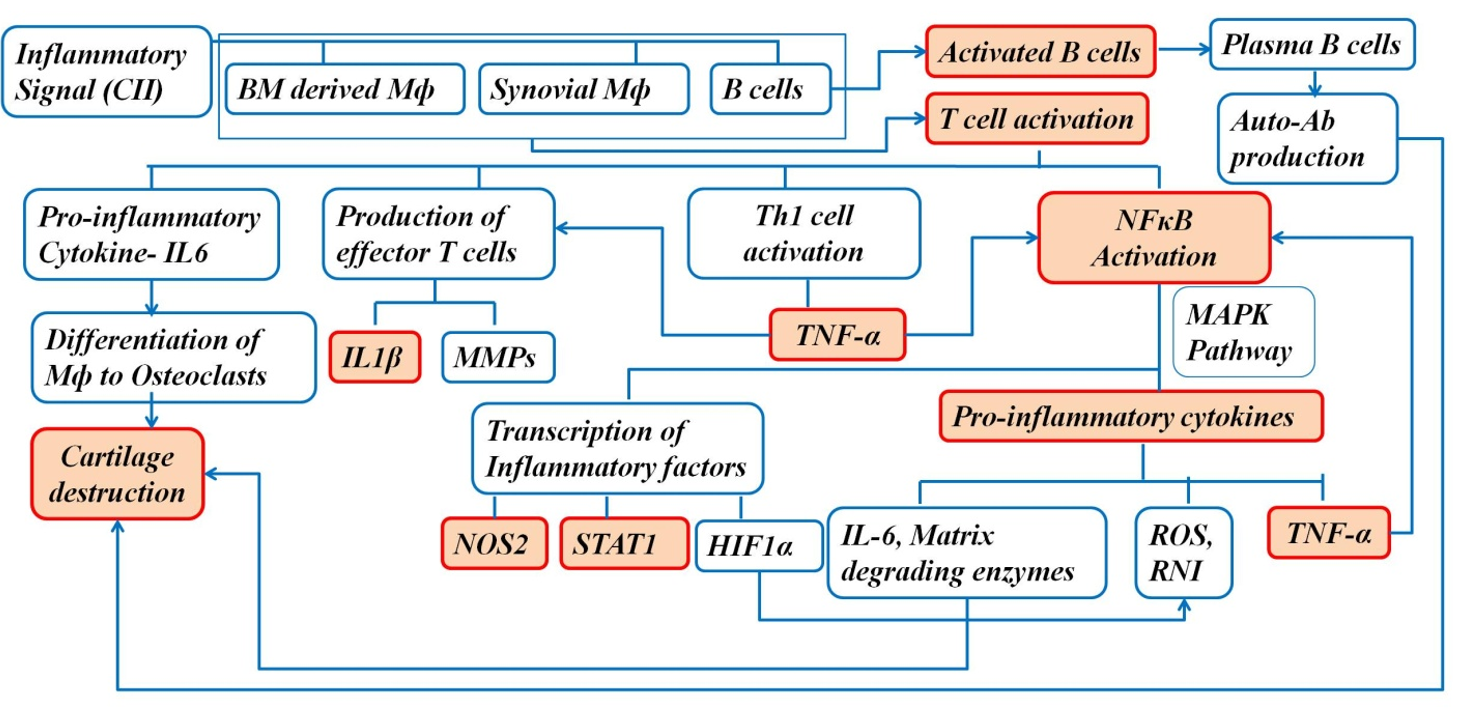
The increased number of macrophages in the synovium is associated with disease severity, and macrophage depletion in the synovium reduces joint inflammation in arthritis1. The activated macrophages in the synovium drive the progression of the disease by producing proinflammatory cytokines and chemokines, such as TNFα and IFNγ1. NFκB plays an important role in the pathogenesis of arthritis; it mediates transcription of target genes, such as TNFα, IL-1β, iNOS, and IL-61. Therefore, blocking NFκB can help in controlling the inflammatory response in RA1. Proinflammatory cytokines and reactive oxygen intermediates are released by the activated macrophages, which are the effector cells driving synovial inflammation1. The increased secretion of proinflammatory cytokines results in an imbalance between pro- and anti-inflammatory cytokine activity, leading to autoimmunity followed by chronic inflammation and joint damage4. In addition to the joints, the disease is also associated with gastrointestinal sequelae, renal malfunction, and cardiovascular risks4. Moreover, the disease has systemic manifestations, such as subcutaneous nodules, pleuritis, pericarditis, and vasculitis, contributing to mortality and morbidity throughout the development of RA4.
The complexity and occurrence of the disease is associated with various factors, including genetic components and environmental factors4. The interaction between environmental factors and genetic components is associated with disease development4. Environmental risk factors include intake of coffee, alcohol, and oral contraceptives, birth weight irregularities, and breast feeding4. The main symptoms of RA are joint warmth, stiffness, loss of joint motion, joint redness, swelling, joint tenderness, pain, and fatigue4. The proinflammatory cytokines have destructive effects on bones and cartilage.
In RA, T cells proliferate and activate B cells and macrophages, which trigger the release of cytokines, such as TNF and IL, generating an inflammatory response that causes joint destruction and extra-articular complications4. These complications, over an extended period, lead to infections, cardiovascular disease, lymphomas, and osteoporosis4.
Guar gum (GG) is a high molecular-weight, non-ionic polysaccharide gum present in the seeds of the leguminous plant Cyamopsis tetragonoloba 5 (Figure 1). It has a galactomannan component with a 1:2 galactose-mannose ratio and exhibits viscous, gel-like consistency in water5. GG has been modified in the form of nanoparticle to facilitate its uptake by cells6, 7, 8. The GG nanoparticle (GN) is a spherical shaped molecule 80 nm in size, with 4:1 mannose:galactose6. A previous study evaluated the analgesic activity of a GG-derived galactomannan polysaccharide in joint pain in an osteoarthritis model9.
Synovial macrophages and synovial fibroblasts are the two leading cell types in the terminal layer of hyperplasic synovial tissue that invade and degrade adjacent cartilage and bone10. The surface-functionalized GNs, enriched with mannose, used in this study show increased affinity for the mannose receptors expressed on macrophages. The activation of mannose receptor has protective implications in the disease. Therefore, the uptake of mannose-enriched GNs by macrophages, which drive the inflammatory process, functions to restore joint destruction.
The small size of GNs is associated with increased bioavailability, low cytotoxicity, and high efficacy at a lower dose. The anti-inflammatory activity of GNs has previously been validated in peritonitis7, 8 and atopic dermatitis (AD) mouse models8. Through this study, GN is repurposed in arthritis, which was previously achieved in AD and peritonitis models of inflammatory diseases.

Methods
In vivo studies in CIA model
Animals
All in vivo experiments were performed according to the regulations of the institutional and departmental animal ethics committee (reg. no. 885/ac/05/CPCSEA). The animals were housed under specific pathogen-free conditions at the animal housing facility of the Department of Zoology, University of Calcutta.
We used 6-week-old female C57BL/6 mice, 20–25 gm in weight, and divided the sample into four experimental groups, with four mice in each group. Group I (control) was free from any treatment, Group II (CII+CFA/IFA) was treated with collagen II (CII), and the Group III (CII+CFA+GN) was treated with CII+CFA and further administered GN orally.
Induction of the disease
On day 0, mice in Group II and III were administered 50 μl of 5 mg/ml CII+CFA emulsion intradermally via the tail and challenged with 50 μl of 5 mg/ml CII+IFA emulsion on day 14 in a similar way. CII-CFA/IFA mixture was prepared by mixing 4 mg CII with 0.05 M acetic acid and placed in a RotoSPIN at 4°C overnight. The mixture was mixed with an equal volume of CFA and IFA to prepare 4 mg/ml of CII+CFA and CII+IFA, respectively.

Treatment with GN
From day 14 onwards, Group III were administered 0.04 mg (1.6 MPK) GN orally on alternating days. The mice were sacrificed on day 42 by cervical dislocation (Figure 2).
Assessment of thickness
Swelling in the hind legs and paws was assessed with the thickness (mm) of the knee joint and paws of mice, which was measured on days 7, 14, 21, 28, 35 and 42 using slide a caliper (Mitutoyo South Asia Pvt. Ltd).
Sacrifice and collection of tissues
On day 42, the mice were sacrificed by cervical dislocation. Peripheral blood (PB), serum, spleen, BM, and synovial tissue were collected according to the protocol mentioned in the Mitra et al. (2022)11. The paw and knee joints were collected, and the skin and muscles were removed and processed for histological evaluation.
Peripheral blood
PB was drawn by cardiac puncture, and one drop of blood was used for smear preparation. The remaining blood sample was collected in EDTA-coated vials (BD Biosciences, USA), and a blood smear was prepared on a microscope slide for the differential count.
Serum
PB was collected in tubes without any anticoagulant, allowed to stand for 30 mins, and centrifuged at 10000 rpm for 10 mins at 4°C. The supernatant was collected in a fresh tube and stored at -80°C until further analysis.
Bone marrow
The femur bones were collected; both the ends were cut, and cells were flushed out with fresh DMEM using a syringe.
Spleen
The spleen was placed directly into DMEM in a petri dish, homogenized between the frosted ends of the slide, and passed through the cell strainer.
Synovium
The synovium from the hind leg was excised and collected in a suitable medium, depending on the type of assay12.
Processing of tissues for histological assessment
Harvested paw and joint tissues were fixed in 10% buffered paraformaldehyde for 72 hours and decalcified in 10% EDTA solution (pH = 7.4) for 30 days. The tissues were then processed for histological assessment, and hematoxylin and eosin (H&E) staining was performed. The stained sections were observed at 10× and 40× under a Dewinter Fluorex LED light microscope.
Total cell count
Total cell counts of PB/BM/spleen/synovium cell suspensions were performed using trypan blue staining, as described previously6, 11.
Differential count
Differential cell counts of PB smears were performed using Giemsa staining, as described previously6, 11.
Determination of immune cell migration by immunophenotyping
PB/BM/spleen/synovium cells were stained, as described in our previous work6, 11. The immunophenotyping study was performed using a BD FACSVerse flow cytometer (BD Biosciences, USA), and the results were analyzed using FACSuite software.
Colony-forming unit (CFU-c) assay
CFU-c assay for PB/BM/spleen/synovium was performed, as described previously6, 11.
Nitric oxide (NO) assay
Serum NO content was estimated by Griess reagent, according to the protocol described by Mitra et al. (2022)11.
Gene expression by reverse transcription-PCR (RT-PCR)
RNA extraction from the synovial tissue was performed using the Trizol method. Gene expression of inflammatory cytokines (IL-1β, NOS2, and TNFα) were assessed, with GAPDH as the housekeeping gene, as described previously11. We used the following primers (3'-5'):
IL1β-F: TCATGGGATGATGATGATAACCTGCT
IL1β-R: CCCATACTTTAGGAAGACACGGATT
NOS2-F: AATGGCAACATCAGGTCGGCCATCACT
NOS2-R: GCTGTGTGTCACAGAAGTCTCGAACTC
TNFα F: GGCAGGTCTACTTTGGAGTCATTGC
TNFα R: ACATTCGAGGCTCCAGTGAATTCGG
Protein expression by Western blot
Total protein was extracted from the synovial tissue, as described in the previous study11. Protein expression of the inflammatory markers (NFκB, HIF1α, NOS2, and STAT1) was assessed according to the protocol described previously11.
Results
Through this study, we have tried to understand the etiology of RA in a murine model of CIA through assessment of severe joint inflammation. The inflammatory response is determined initially by visible changes in joint and paw thickness throughout the disease progression, followed by changes associated with synovial inflammation at the tissue, cellular, and molecular levels. We analyzed the anti-inflammatory effect of orally administered GNs in a murine model of CIA. During the treatment regimen, knee joint and hind paw thickness was assessed, and the effect of GN was evaluated.


GN reduced knee joint and paw thickness
On days 0, 7, 14, 21, 35, and 42, the thickness of the knee joint and paw was measured using a microcaliper to assess swelling in the joints and paws.
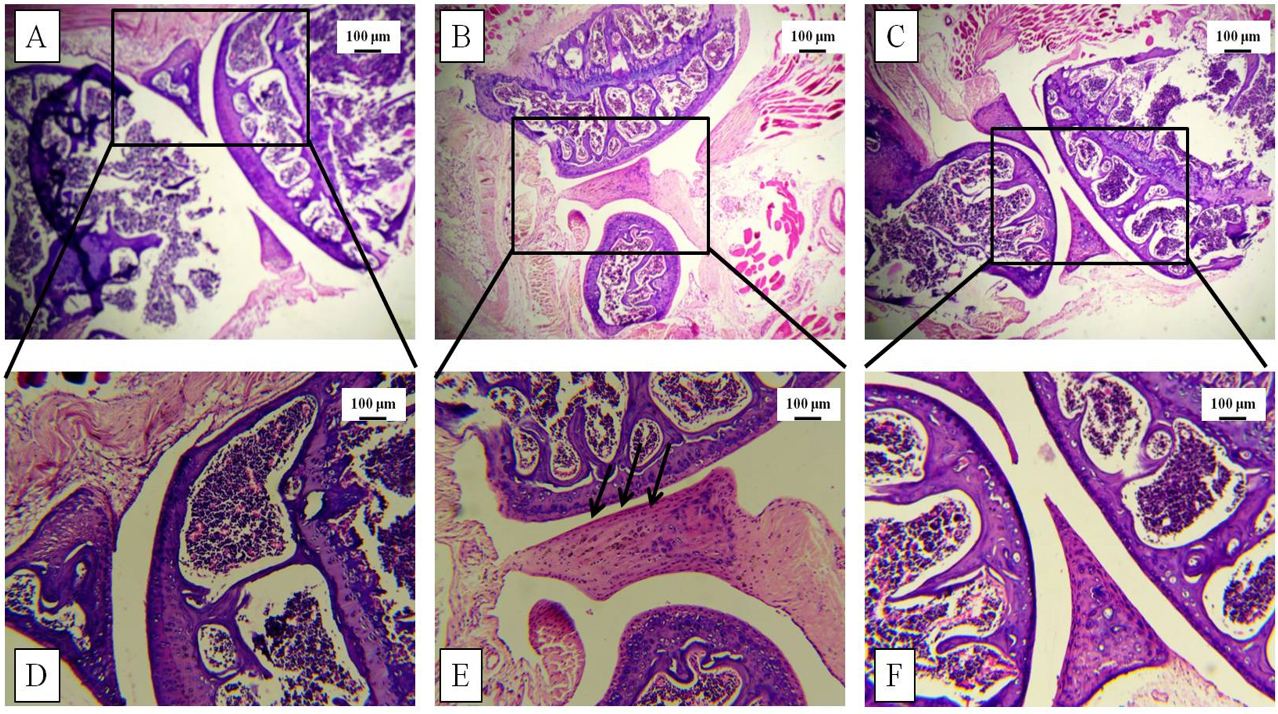
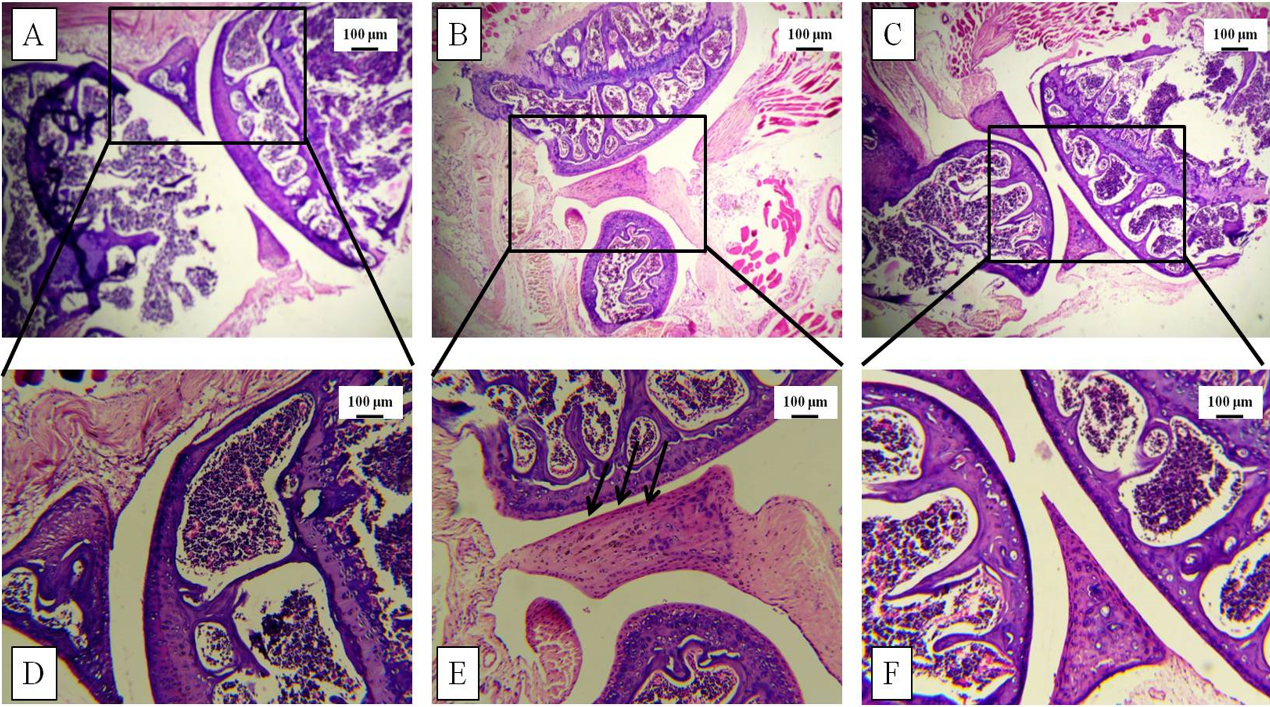
GN restored the tissue architecture of the knee joint
Increased thickness of the knee joint and paw was correlated with histological studies via H&E staining post-sacrifice. The tissue architecture demonstrated synovial hyperplasia, cellular infiltration, and partial joint destruction in the CII-treated mice, whereas GN administration reduced the synovial hyperplasia. Furthermore, oral administration of GN reduced the cellular infiltration in the synovium and restored the joint destruction (Figure 5, Figure 6).
GN reduced cellular infiltration in the BM, PB, spleen, and synovium
Total cell count in the BM, PB, spleen, and synovium was assessed to obtain a preliminary understanding of the inflammatory cells involved in systemic and local inflammation due to arthritis in mice. The total count of BM cells, PB cells, spleen cells, and synovial cells was increased 1.72-fold (p < 0.05), 1.83-fold (p < 0.05), 2.23-fold (p < 0.05), and 2.44-fold (p < 0.05), respectively, following CII treatment. However, the total cell count was decreased by 1.36-fold (p < 0.05) in the BM, 1.26-fold in the PB, 2.26-fold (p < 0.05) in the spleen, and 1.58-fold (p < 0.05) in the synovium following GN treatment. Therefore, GN led to decreased infiltration of inflammatory cells in the BM, PB, spleen, and synovium (Figure 7).
Immunophenotyping of cells
CD45+ cells from BM, PB, spleen, and synovium were gated and analyzed for B220+ cells (B cells), CD3+ cells (T cells), CD3+CD4+ cells (Th cells), CD3+CD8+ (Tc cells), GR1+ (neutrophils), and F4/80+ (macrophages).
GN restored the population of B cells, T cells, neutrophils, and macrophages in bone marrow
In the BM, CII treatment led to an increase in immune cells, indicating an increased production of these cells in the presence of inflammatory stimuli. CD45+B220hi and CD45+B220low B cell counts was increased by 3.09-fold (p < 0.05) and 16.83-fold (p < 0.05), respectively, compared to the control group (Figure 8 A). Their counts were reduced following GN treatment by 3.16-fold (p < 0.05) and 4.17-fold (p < 0.05), respectively (Figure 8 A), as compared with the CII treatment group. Furthermore, CII treatment led to a 3.62-fold increase in the number of T cells (p < 0.05), 4.44-fold increase in Th cells (p < 0.05), 9.76-fold increase in Tc cells (p < 0.05) (Figure 8 B), 10.16-fold increase in neutrophils (p < 0.05), and 2.07-fold increase in macrophages (p < 0.05) (Figure 8 C). GN reduced the number of T cells 1.05-fold (p < 0.05) (Figure 8 B), Th cells by 1.45-fold (p < 0.05), Tc cells by 2.12-fold (p < 0.05) (Figure 8 B), neutrophils by 2.85-fold (p < 0.05), and macrophages by 1.38-fold (p < 0.05) (Figure 8 C).
Effect of GN on B cell, T cell, neutrophil, and macrophage populations in the blood
In the blood, CII treatment led to an increase in the populations of immune cells, indicating increased migration of these cells in the presence of inflammatory stimuli. CD45+B220+ B cell count was increased by 4.13-fold (p < 0.05) compared with the control group (Figure 9 A) and were reduced 1.42-fold following GN treatment (p < 0.05) (Figure 9 A) compared with the CII treatment group. Furthermore, CII treatment led to a 4.84-fold increase in the number of T cells (p < 0.05), 10.26-fold increase in Th cells (p < 0.05), 3-fold increase in Tc cells (Figure 9 B), 1.78-fold increase in neutrophils (p < 0.05), and 1.88-fold increase in macrophages (p < 0.05) (Figure 9 C). GN reduced the number of T cells 2.7-fold (p < 0.05), Th cells 2.86-fold (p < 0.05), Tc cells 3.93-fold (p < 0.05) (Figure 9 B), and macrophages 1.40-fold (p < 0.05) (Figure 9 C).
GN controlled the T cell, neutrophil, and macrophage populations in the spleen
In the spleen, CII treatment led to an increase in the population of immune cells, indicating increased migration of these cells to the spleen in the presence of inflammatory stimuli. The CD45+B220+ B cell count increased by 2.61-fold (p < 0.05) compared with the control group (Figure 10 A) and was reduced by 3.42-fold following GN treatment (p < 0.05) (Figure 10 A) compared with the CII treatment group. Furthermore, CII treatment led to a 1.85-fold increase in the number of T cells (p < 0.05), 1.94-fold increase in Th cells, 1.82-fold increase in Tc cells (Figure 10 B), 2.3-fold increase in neutrophils (p < 0.05), and 2.02-fold increase in macrophages (Figure 10 B). GN reduced the number of T cells by 2.08-fold, Th cells 2.34-fold (p < 0.05), Tc cells by 1.95-fold (Figure 10 B), neutrophils by 1.01-fold, and macrophages 2.57-fold. (Figure 10 C).
GN reduced the B cell, T cell, neutrophil, and macrophage populations in the synovium
In the synovium, CII treatment led to an increase in the population of immune cells, indicating increased migration and proliferation of these cells to the synovium in the presence of inflammatory stimuli. The CD45+B220+ B cell count was increased by 3.6-fold (p < 0.05) compared with the control group (Figure 11 A) and was reduced by 1.6-fold following GN treatment (p < 0.05) (Figure 11 A) compared to the CII treatment group. Furthermore, CII treatment led to a 2.84-fold increase in the number of T cells (p < 0.05), 1.99-fold increase in Th cells (p < 0.05), 2.32-fold increase in Tc cells (p < 0.05) (Figure 11 B), 19.73-fold increase in neutrophils (p < 0.05), and 6.2-fold increase in macrophages (p < 0.05) (Figure 11 C). GN reduced the number of T cells by 13.05-fold (p < 0.05), Th cells by 2.34-fold (p < 0.05), Tc cells by 1.95-fold (Figure 11 B), neutrophils by 4.91-fold (p < 0.05), and macrophages by 3.5-fold (p < 0.05) (Figure 11 C).
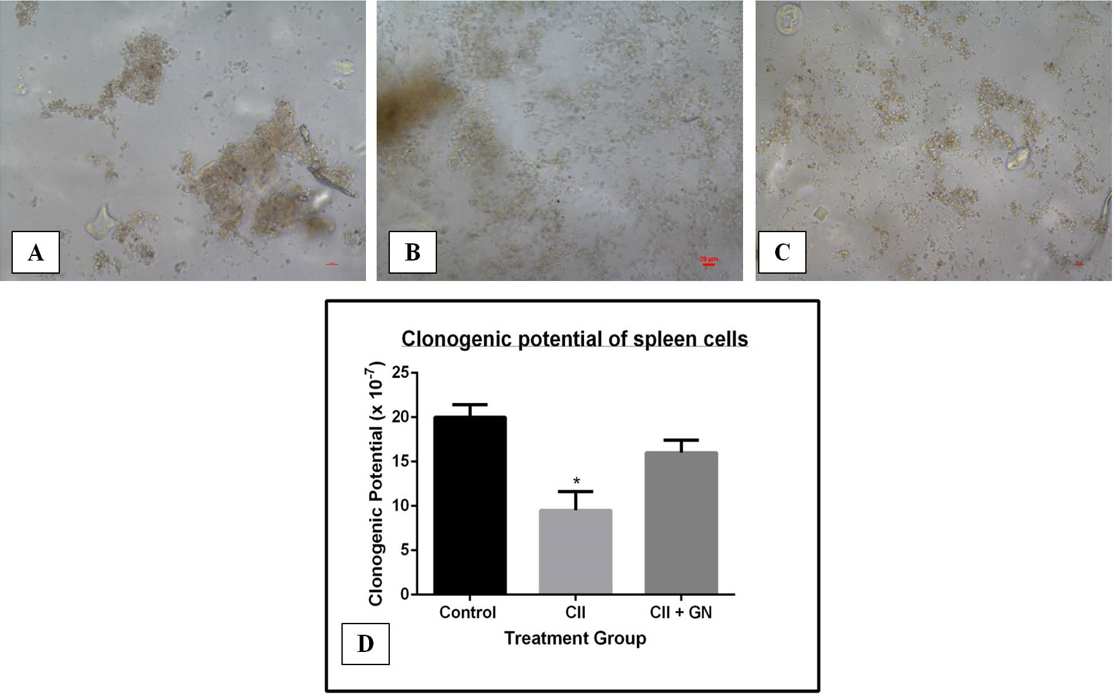
GN increased the clonogenic potential of cells
The proregenerative effect of GN was assessed by measuring the clonogenic potential of BM, PB, synovial, and spleen cells. CII treatment decreased the clonogenic potential of BM cells 3.79-fold compared to the control group (p < 0.05) (Figure 12). GN treatment increased the clonogenic potential by 1.7-fold compared to the CII treatment group (p < 0.05) (Figure 12).
The clonogenic potential of the blood cells was decreased by 3.34-fold in the CII treatment group compared to the control group (p < 0.05) (Figure 13). GN treatment restored the clonogenic potential by 1.82-fold compared to the CII group (p < 0.05) (Figure 13).
The clonogenic potential of the synovial cells was decreased by 13.15-fold compared to the CII group (p < 0.05) (Figure 14). Clonogenic potential was restored by 6.63-fold compared to the CII group following GN treatment (p < 0.05) (Figure 14).
The clonogenic potential of spleen cells decreased by 3.73-fold compared to the control group (p < 0.05) (Figure 15). Clonogenic potential was restored by 3.43-fold compared to the CII group following GN treatment (p < 0.05) (Figure 15).
NO estimation in the serum
NO is an important mediator involved in RA pathogenesis. Serum NO level was increased by 4.88-fold following CII treatment (p < 0.05), and GN treatment reduced the NO level by 1.13-fold (p < 0.05) (Figure 16).
Expression of proinflammatory cytokines and signaling molecules at the gene level
The expression of proinflammatory cytokines and signaling molecules, including IL-1β, NOS2, and TNFα, compared with the expression of GAPDH, a house keeping gene, was determined in terms of band intensities (Figure 17 A). Following CII treatment, the expression of IL-1β, NOS2, and TNFα increased by 7.39-fold (p < 0.05), 2.69-fold (p < 0.05), and 11.82-fold (p < 0.05), respectively (Figure 17 B). GN reduced the gene expression of proinflammatory cytokines IL-1β, NOS2, and TNFα compared with the expression of GAPDH (Figure 17 A). CII increased the expression of IL-1β, IL13, NOS2, and TNFα by 7.39-fold, 2.62-fold, and 120.58-fold, respectively (Figure 17 A). GN reduced the expression of IL-1β, IL13, NOS2, and TNFα by 2.55-fold, 2.33-fold, and 2.50-fold, respectively (Figure 17 B). Therefore, GN administration down regulated the expression of proinflammatory cytokines and signaling molecules at the gene level.
Expression of proinflammatory cytokines and signaling molecules at the protein level
The protein expression of the inflammatory markers, namely NFκB, HIF1α, NOS2, and STAT1, were assessed and compared with the expression of the housekeeping protein GAPDH (Figure 18 A). Following CII treatment, the expression of NFκB, HIF1α, NOS2, and STAT1 was upregulated by 20.11-fold (p < 0.05), 9.28-fold (p < 0.05), 16.59-fold (p < 0.05), and 2.75-fold (p < 0.05), respectively (Figure 18 B). GN reduced the expression of NFκB, NOS2, and STAT1 by 2.94-fold (p < 0.05), 1.32-fold (p < 0.05), and 1.89-fold (p < 0.05), respectively. The expression of HIF1α was increased following GN treatment; however, the difference was not significant (Figure 18 B). Therefore, GN down regulated the expression of inflammatory markers and signaling molecules at the protein level.
Discussion
Through this study, we have assessed the effect of GN on CII-induced arthritis in a mouse model. On day 0, the mice in the diseased group were sensitized using CII and CFA with heat-killed Mycobacteria containing muramyl dipeptide, which is the active component of the mycobacterial cell wall. This dipeptide is mainly responsible for activating innate immune cells, such as macrophages and dendritic cells13. On day 14, the mice in Group II and III were challenged with CII and IFA, where the water-in-oil emulsion contained antigen in aqueous solution, paraffin oil, and a surfactant, such as mannide monooleate, which collectively ensured the prolonged release of CII from the site of injection13. The diseased and therapeutic groups were administered with CII, and the therapeutic group was also administered 20 μl GN (2 mg/ml) orally from day 14 onwards, on alternating days, till day 42. Joint (Figure 3) and paw thickness (Figure 4) was assessed throughout the course of experiment.
During the experiment, hind paw and knee joint swelling was assessed using a microcaliper. The knee joint thickness of CII-treated mice increased significantly from day 14 onwards. However, GN administration led to a decrease in the thickness from day 28, and a significant reduction was observed from day 35 onwards (Figure 3). Similarly, paw thickness in the diseased group showed increased thickness, although a significant change was observed from day 35 onwards. GN administration reduced paw thickness from day 35 onwards (Figure 4). Therefore, our study showed the CII was able to cause joint inflammation, and GN administration caused reduction in the thickness from day 28 onwards, but not earlier. The initial response to the oral GN was slow due to a lack of blood vessels in the cartilage, and the bone microenvironment was restored after repeated administration14. The bone matrix contains hydroxyapatite, which is composed of a high concentration of positively charged Ca2+; therefore, negatively charged drugs exhibit a higher affinity for the bone matrix15. The GN used in this study carries a negative surface charge in aqueous environments, helping to maintain the bone microenvironment in GN-treated mice7, 8. The joint and paw swelling was further corroborated by histological studies on the knee joint and hind paw after sacrifice of the mice.
Histopathological studies were conducted to assess the tissue architecture of the knee joint and hind paw by H&E staining. The control mice showed normal, healthy articular space and tissues, whereas the diseased group showed synovial hyperplasia, massive infiltration of inflammatory cells, articular cartilage destruction, and bone erosion. These events contributed to the increased thickness of the knee joint in the diseased mice. GN administration caused reduction in pathological events, such as synovial hyperplasia, inflammatory cell infiltration, and bone erosion (Figure 5, Figure 6). To assess the infiltration of inflammatory cells, cellular events were investigated in the PB, BM, spleen, and synovial tissue. Total count of cells in the PB, BM, spleen, and synovium was significantly increased in the diseased group, which indicated progression of the disease. GN administration reduced cell counts (Figure 7). Therefore, the results obtained from total cell counts in the synovium indicated the mobilization of inflammatory cells following CII administration.
To better understand the role of cellular events in the pathogenesis of RA, flow cytometry was performed to assess the variation in the number of B cells, T cells, macrophages, and neutrophils. The functional role of these cells in the BM (the site of poiesis), spleen (the secondary lymphoid organ), PB (systemic circulation), and synovium (the tissue of interest) was assessed to better understand the pathway of migration of cells during the inflammatory process caused by CII and the effect of GN on this process. The BM provides an appropriate microenvironment for the development of T cells in the absence of the thymus. In the presence of an inflammatory signal, lymphoid follicles in the BM are increased16. In the first step of inflammation, activated granulocytes and monocytes residing in the BM microenvironment release DAMPs17. Mediators, such as DAMPs and ROS, activate proteolytic enzymatic cascades in the BM microenvironment, mainly the complement cascade (ComC), which is responsible for complement-mediating egress from the BM17. First, there is release of hematopoietic stem and progenitor cells (HSPCs) from their niches in the BM, permeabilization of the BM–PB endothelial barrier, followed by egress of neutrophils and monocytes into the PB through a process that paves the way for HSPCs to follow the mobilizing gradient of bioactive phosphosphingolipids (sphingosine-1-phosphate, S1P, and ceramide-1-phosphate, C1P) originating in PB. Therefore, the egress of cells is directed from the BM to the PB and secondary lymphoid organs17. Moreover, the lymphocyte population recirculates through the BM because it is vascularized16. Therefore, we observed an increased number of circulating immune cells, including macrophages, in the BM (Figure 8) and blood (Figure 9) in the diseased mice, and a decreased cell number following GN administration.
The spleen is a secondary lymphoid organ that acts as a filter for antigens and pathogens. The leukocytes present in the spleen include various subsets of B cells, T cells, dendritic cells, and macrophages18. Circulating T and B cells are guided by stromal cell networks, integrins, and chemokines (CXCL13, CCL19, and CCL21) toward the spleen followed by the synovium of their cognate antigen. The chemokines are mainly responsible for their maintenance in the B- and T-cell zone18. In this study, we found a significant increase in the number of B cells, T cells, Th cells, and Tc cells in the spleen of the diseased mice, which indicated that an increased number of circulating lymphocytes had gained access to the spleen (Figure 10). However, GN administration reduced the number of cells almost to the control level (Figure 10). A study reported increased migration of macrophages in the spleen during an inflammatory signal19. Accordingly, F4/80+ cells (macrophages) were also increased significantly in the spleen and decreased following GN administration.
Synovial macrophages reside in the sub-lining layer and lining layer at the cartilage–pannus junction, which facilitates their role in mediating articular destruction and regulating the secretion of proinflammatory cytokines and enzymes involved in driving the inflammatory response and joint destruction20. Upon receiving an inflammatory signal, the number of synovial macrophages is increased, which signals leukocyte and lymphocyte recruitment, fibroblast proliferation, and protease secretion, leading to joint destruction20. The cytokines (TNFα, IL1β) in the inflamed joints direct the B cells, T cells, Th cells, and Tc cells to the synovium21. Neutrophils are released from the BM immediately following the first sign of inflammation. Their mobilization to the synovium is orchestrated by the hematopoietic cytokine granulocyte colony-stimulating factor (G-CSF), chemokines, C5a complement fragment, and leukotriene B422. Therefore, in our study, populations of the B cells, T cells, neutrophils, and macrophages were increased in the synovium of diseased mice and decreased following GN administration (Figure 11).
The clonogenic potential of BM (Figure 12), PB (Figure 13), spleen (Figure 14), and synovial (Figure 15) cells was assessed by CFU assay. CFU assay involves functional analysis of the self-renewal potency of hematopoietic stem cells (HSCs), which are the progenitors of all blood and immune cells23. Therefore, assessment of clonogenic potential by CFU assay is critical for determining the therapeutic application of an agent. In this study, the clonogenic potential of the progenitors in the BM, spleen, PB, and the synovium was assessed to measure the proregenerative activity of GNs in those tissues. Under inflammatory signals, the propensity to form colonies is reduced, as the inflammatory signaling cascade (proinflammatory cytokines viz. TNFα) has devastating effects on HSCs24. The synovium is mainly associated with two types of cells: macrophage-like synovial cells (type A) and fibroblasts-like cells (type B). Type A cells are of hematopoietic origin; they migrate from the BM to the synovium and become tissue resident cells25. During inflammation, type A cells induce type B cells to cause synovitis, leading to destruction of the extracellular matrix (ECM) and reducing the potency of cells to form colonies25. However, GN administration restored the clonogenic potential, indicating its possible role in the maintenance of the ECM. Therefore, from our observations, in addition to the anti-inflammatory activity of GN, it also shows proregenerative activity. Both these properties substantiate GN as a possible therapeutic molecule in translational medicine.
Serum NO level was significantly elevated in the diseased group and was reduced following GN administration (Figure 16). NO release further stimulates proinflammatory cytokines to mediate the inflammatory process followed by bone and cartilage erosion26. Expression of cytokines, such as TNFα, IL1β, and NOS2, in the synovial tissue was increased significantly in the diseased group, whereas GN administration downregulated expression of these cytokines (Figure 17). NOS2 expression was also increased in the synovium and was further downregulated by GN (Figure 17, Figure 18). The cartilage in the joint is associated with synovial fibroblasts and chondrocytes. Proinflammatory cytokines, such as TNFα and IL1β, stimulate these cells to secrete enzymes that degrade the proteoglycan and collagen in the cartilage, leading to tissue destruction27. Therefore, from our observations, GN restores the bone microenvironment by downregulating the expression of proinflammatory cytokines.
As there is continuous expansion of the synovium in arthritic joints, the supply of blood-borne O2 is depleted, creating a hypoxic microenvironment in the synovial tissue of an arthritic joint28. HIF1α expression was upregulated in the diseased group due to increased hypoxic conditions in the joints. Studies have reported the localization of STAT1 in B and T lymphocytes29. In this study, the expression of STAT1 was up-regulated due to the increased number of B cells and T cells, as corroborated by the immunophenotyping studies (Figure 18).
Oral delivery of drugs is the most convenient and noninvasive route for the administration; however, enzymatic degradation in the gastrointestinal tract and limited permeation remains a concern30. Nano-formulation of drugs has been explored as a potential solution due to their ability to cross the intestinal epithelium toward the target site30. The anti-inflammatory activity of GNs used in this study reduced the inflammatory events in the bone microenvironment (Figure 19). Therefore, our analysis at the tissue level (histopathological studies), cellular level (migration of immune cells), and molecular level (proinflammatory cytokines, signaling molecules, and mediators) indicated that orally administered GN has a positive role in maintaining the bone microenvironment and subsequently alleviating the symptoms of arthritis.
Conclusions
As there is no permanent cure for arthritis, the therapeutic effects of GN were explored in CIA. Orally administered GN (1.6 MPK) appears to be effective in treating CIA and has shown anti-inflammatory and pro-regenerative activity. GN controlled inflammation by targeting macrophages, causing subsequent downregulation of pro-inflammatory markers and restoring the synovial inflammation in a pre-clinical mouse model. Through our study, we conclude that GN may act as a potential therapeutic molecule that can overcome the shortcomings of available therapies in CIA.
Abbreviations
BM: Bone marrow; CD: Cluster of differentiation; CFU: Colony forming unit; CIA: Collagen induced arthritis; CII: Collagen type II; DC: Differential count; DMEM: Dulbecco’s Modified Eagle Medium; EDTA: Ethylenediaminetetraacetic acid; G-CSF: Colony Stimulating Factor; GG: gum; GN: gum; H&E: Hematoxylin and eosin; HIF: Hypoxia inducible factor; HSPCs: Stem and Progenitor Cells; IL: Interleukin; NFκB: Nuclear factor Kappa-light-chain enhancer of activated B cells; NO: Nitric oxide; NOS: Nitric oxide; PB: Peripheral blood; PBS: Phosphate buffered saline; RA: Rheumatoid arthritis; RNA: nucleic acid; RT-PCR: Reverse transcription Polymerase Chain Reaction; STAT1: Signal transducer and activator of transcription 1; TC: Total count; TNF: Tumor necrosis factor
Acknowledgments
We would like to acknowledge Dr. Arup Mukherjee, Department of Chemical Technology, University of Calcutta, and his research fellow Mr. Sumanta Kumar Ghosh, for supplying us with the GN. We also acknowledge the BD- CoE at the Centre for Research in Nanoscience & Nanotechnology (CRNN),University of Calcutta, Kolkata, for allowing us to use the BD FACSVerse.
Author’s contributions
NG designed and performed the experiment and the assays, analyzed the data and wrote the manuscript. SM performed the experiment and some of the assays. ERB initiated the project, designed the experiments, analyzed the data and wrote the manuscript. All authors read and approved the final manuscript.
Funding
This work was supported by Prof. Ena Ray Banerjee's grants from the Indian Council of Medical Research (ICMR), UGC-UPE-II and UGC-SAP. We acknowledge the funding agencies ICMR for providing fellowship to NG and University Grant Commission (UGC), for providing fellowship to SM.
Availability of data and materials
Data and materials used and/or analyzed during the current study are available from the corresponding author on reasonable request.
Ethics approval and consent to participate
Not applicable.
Consent for publication
Not applicable.
Competing interests
The authors declare that they have no competing interests.
References
-
Wang
Q.,
Sun
X.,
Recent advances in nanomedicines for the treatment of rheumatoid arthritis. Biomaterials Science.
2017;
5
(8)
:
1407-20
.
View Article PubMed Google Scholar -
Wipke
B.T.,
Allen
P.M.,
Essential role of neutrophils in the initiation and progression of a murine model of rheumatoid arthritis. Journal of Immunology (Baltimore, Md.: 1950).
2001;
167
(3)
:
1601-8
.
View Article PubMed Google Scholar -
Xu
D.,
Lin
Y.,
Shen
J.,
Zhang
J.,
Wang
J.,
Zhang
Y.,
Overproduced bone marrow neutrophils in collagen-induced arthritis are primed for NETosis: an ignored pathological cell involving inflammatory arthritis. Cell Proliferation.
2020;
53
(7)
:
e12824
.
View Article PubMed Google Scholar -
Janakiraman
K.,
Krishnaswami
V.,
Rajendran
V.,
Natesan
S.,
Kandasamy
R.,
Novel nano therapeutic materials for the effective treatment of rheumatoid arthritis-recent insights. Materials Today. Communications.
2018;
17
:
200-13
.
View Article PubMed Google Scholar -
R. Sahoo,
P.J.S. Jacob,
S. Sahoo,
Biomedical application of green biopolymer guar gum. Journal of Pharmaceutical and Biomedical Sciences.
2013;
35
:
1783-7
.
-
Ghosh
S. K.,
F. Abdullah,
A. Mukherjee,
Fabrication and labeling of guar gum nanoparticles in a surfactant free aqueous environment. Materials Science and Engineering C.
2015;
46
:
521-9
.
View Article PubMed Google Scholar -
N. Ghosh,
S. Mitra,
S. Biswas,
E.R. Banerjee,
Mannose-rich guar gum nanoparticles as a novel therapeutic drug against inflammatory diseases. Journal of Molecular Biochemistry.
2018;
7
:
14-27
.
-
N. Ghosh,
Mitra
S.,
E. Ray Banerjee,
Therapeutic effects of topically- administered guar gum nanoparticle in oxazolone- induced atopic dermatitis in mice. Biomedical Research and Therapy.
2018;
5
(5)
:
2305-25
.
View Article Google Scholar -
Castro
R. R.,
Silva
C. M. M,
Nunes
R. M.,
Cunha
P.,
Paula
R. de,
.Feitosa
J.,
Girão
V.,
.Pompeu
M.,
Leite
J. D.,
Rocha
F.,
Structural characteristics are crucial to the benefits of guar gum in experimental osteoarthritis. Carbohydrate polymers.
2016;
150
:
392-399
.
View Article PubMed Google Scholar -
Müller-Ladner
U.,
Ospelt
C.,
Gay
S.,
Distler
O.,
Pap
T.,
Cells of the synovium in rheumatoid arthritis. Synovial fibroblasts. Arthritis research & therapy.
2007;
9
(6)
:
1-10
.
View Article Google Scholar -
S. Mitra,
Ghosh
N.,
Paul
P.,
Banerjee
E.R.,
Orally-Administered Fisetin Reduces the Symptoms of Acute Allergic Asthma in a Preclinical Mouse Model. Biomedical Research and Therapy.
2022;
9
(3)
:
4953-70
.
View Article Google Scholar -
Futami
I.,
Ishijima
M.,
Kaneko
H.,
Tsuji
K.,
Ichikawa-Tomikawa
N.,
Sadatsuki
R.,
Isolation and characterization of multipotential mesenchymal cells from the mouse synovium. PLoS One.
2012;
7
(9)
:
e45517
.
View Article PubMed Google Scholar -
Brandt
E. B.,
Sivaprasad
U.,
Th2 Cytokines and Atopic Dermatitis. J Clin Cell Immunol.
2011;
2
(3)
:
110
.
View Article PubMed Google Scholar -
L.R. Chang,
G. Martson,
A. Martin ,
Anatomy, Cartilage. StatPearls [Internet]. Treasure Island (FL): StatPearls Publishing 2021.
Google Scholar -
M. Stapleton,
Sawamoto
K.,
Alméciga-Díaz
C.J.,
Mackenzie
W.G.,
Mason
R.W.,
Orii
T.,
S. Tomatsu,
Development of Bone Targeting Drugs. International Journal of Molecular Sciences.
2017;
18
(7)
:
1345
.
View Article PubMed Google Scholar -
Zhao
E.,
Xu
H.,
Wang
L.,
Kryczek
I.,
Wu
K.,
Hu
Y.,
Bone marrow and the control of immunity. Cellular & Molecular Immunology.
2012;
9
(1)
:
11-9
.
View Article PubMed Google Scholar -
Ratajczak
M. Z.,
Adamiak
M.,
Plonka
M.,
Abdel-Latif
A.,
Ratajczak
J.,
Mobilization of hematopoietic stem cells as a result of innate immunity-mediated sterile inflammation in the bone marrow microenvironment-the involvement of extracellular nucleotides and purinergic signaling. Leukemia.
2018;
32
(5)
:
1116-1123
.
View Article PubMed Google Scholar -
Bronte
V.,
Pittet
M.J.,
The spleen in local and systemic regulation of immunity. Immunity.
2013;
39
(5)
:
806-18
.
View Article PubMed Google Scholar -
Li
Y.,
Wu
J.,
Xu
L.,
Wu
Q.,
Wan
Z.,
Li
L.,
Regulation of Leukocyte Recruitment to the Spleen and Peritoneal Cavity during Pristane-Induced Inflammation. Journal of Immunology Research.
2017;
2017
:
9891348
.
View Article PubMed Google Scholar -
Kennedy
A.,
Fearon
U.,
Veale
D.J.,
Godson
C.,
Macrophages in synovial inflammation. Frontiers in Immunology.
2011;
2
:
52
.
View Article PubMed Google Scholar -
Brennan
F.M.,
McInnes
I.B.,
Evidence that cytokines play a role in rheumatoid arthritis. The Journal of Clinical Investigation.
2008;
118
(11)
:
3537-45
.
View Article PubMed Google Scholar -
E.C. Rosas,
L.B. Correa,
M.d. Graças Henriques,
Neutrophils in Rheumatoid Arthritis: A Target for Discovering New Therapies Based on Natural Products. In (Ed.), Role of Neutrophils in Disease Pathogenesis. IntechOpen. 2017
.
View Article Google Scholar -
Baldridge
M.T.,
King
K.Y.,
Goodell
M.A.,
Inflammatory signals regulate hematopoietic stem cells. Trends in Immunology.
2011;
32
(2)
:
57-65
.
View Article PubMed Google Scholar -
Clapes
T.,
Lefkopoulos
S.,
Trompouki
E.,
Stress and non-stress roles of inflammatory signals during HSC emergence and maintenance. Frontiers in Immunology.
2016;
7
:
487
.
View Article PubMed Google Scholar -
Bartok
B.,
Firestein
G.S.,
Fibroblast-like synoviocytes: key effector cells in rheumatoid arthritis. Immunological Reviews.
2010;
233
(1)
:
233-55
.
View Article PubMed Google Scholar -
Han
H.M.,
Hong
S.H.,
Park
H.S.,
Jung
J.C.,
Kim
J.S.,
Lee
Y.T.,
Protective effects of Fructus sophorae extract on collagen-induced arthritis in BALB/c mice. Experimental and Therapeutic Medicine.
2017;
13
(1)
:
146-54
.
View Article PubMed Google Scholar -
Luberts
E.,
Berg
W. B. van den,
Cytokines in the pathogenesis of rheumatoid arthritis and collagen-induced arthritis. Adv Exp Med Biol.
2003;
520
:
194-202
.
View Article PubMed Google Scholar -
Imtiyaz
H.Z.,
Simon
M.C.,
Hypoxia-inducible factors as essential regulators of inflammation. Current Topics in Microbiology and Immunology.
2010;
345
:
105-20
.
View Article PubMed Google Scholar -
Kasperkovitz
P.V.,
Verbeet
N.L.,
Smeets
T.J.,
van Rietschoten
J.G.,
Kraan
M.C.,
van der Pouw Kraan
T.C.,
Activation of the STAT1 pathway in rheumatoid arthritis. Annals of the Rheumatic Diseases.
2004;
63
(3)
:
233-9
.
View Article PubMed Google Scholar -
Cheng
H.,
Chawla
A.,
Yang
Y.,
Li
Y.,
Zhang
J.,
Jang
H.L.,
Development of nanomaterials for bone-targeted drug delivery. Drug Discovery Today.
2017;
22
(9)
:
1336-50
.
View Article PubMed Google Scholar
Comments
Article Details
Volume & Issue : Vol 9 No 8 (2022)
Page No.: 5241-5259
Published on: 2022-08-31
Citations
Copyrights & License
This work is licensed under a Creative Commons Attribution 4.0 International License.
Search Panel
Pubmed
Google Scholar
Pubmed
Google Scholar
Pubmed
Search for this article in:
Google Scholar
Researchgate
- HTML viewed - 4538 times
- PDF downloaded - 1287 times
- XML downloaded - 0 times
