

Copyrights: Anna A. Cheprasova, Sergey S. Popov, Aleksander N. Pashkov, Aleksey N. Verevkin, Evgenii D. Kryl’skii, Valentina O. Mittova, 2022. License: This work is licensed under a Creative Commons Attribution 4.0 International License.
Abstract
Introduction: Diabetes mellitus (DM) is an acute biomedical problem whose prevalence in the Russian Federation and elsewhere continues to rise. Regular blood glucose monitoring in patients with DM requires the identification of new approaches for the non-invasive assessment of glycemic parameters. Previous studies assessing the relationship between the biochemical composition of saliva and blood plasma found saliva suitable for DM monitoring. In this study, we assessed correlations between oxidative status and carbohydrate and lipid metabolism indicators in saliva and blood serum of patients with type 1 DM (T1DM).
Methods: We included 80 adults, 40 T1DM patients divided equally into two sex-defined subgroups, 20 men (mean age 43.7 +/- 3.21) and 20 women (42.05 +/- 2.66), and 40 ostensibly healthy individuals, 20 men (41.05 +/- 3.54) and 20 women (43.35 +/- 3.18). Mixed saliva was collected on an empty stomach in the morning, and its glucose, triglyceride, cholesterol, and total protein concentrations were determined. Oxidative status was determined based on biochemiluminescence (BCL) parameters. The chaperone-like activity of saliva was assessed using a model test system based on insulin aggregation suppression.
Results: We found a positive correlation between biochemical parameters in saliva and blood serum and between BCL parameters, chaperone-like activity, and blood glucose level.
Conclusion: Our findings indicate that saliva can be used as a biomaterial for diagnosing and monitoring the T1DM treatment efficiency.
Introduction
Diabetes mellitus (DM) is a group of metabolic diseases characterized by impaired glucose metabolism with hyperglycemia due to impaired insulin secretion, insulin action, or both1. Diagnosing DM and monitoring the effectiveness of its therapy requires regular determination of carbohydrate metabolism parameters in the patient’s blood. Therefore, the increasing incidence of DM motivates the development of non-invasive DM detection methods. Saliva is a promising medium for DM diagnosis.
Mixed saliva is a biological fluid comprising saliva secreted by major and minor salivary glands with significant diagnostic potential. It contains many proteins, peptides, nucleic acids, enzymes, hormones, and other biologically active substances. The salivary glands are sensitive to metabolic changes in the human body. Consequently, the biochemical composition of saliva reflects daily changes in the body. In addition, non-invasive saliva collection enables its use in large-scale health programs for diagnosing various diseases and drug dosing control.
Recent studies have found a relationship between the biochemical composition of saliva and several indicators of hormonal and immune status2, 3, 4. This relationship reflects the permeation of many blood metabolites through the blood-saliva barrier (BSB), providing the selective intake of various chemical compounds by dialysis, diffusion, ultrafiltration, osmosis, and sorption5.
Currently, saliva is a preferred medium in which to search for new diagnostic methods for metabolic diseases. An extensive body of data supports its potential use for monitoring cardiovascular, liver, and skeletal diseases and some endocrine pathologies6. Several studies have demonstrated differences in some biochemical parameters in blood and saliva in healthy individuals and patients with type 1 DM (T1DM), particularly glucose, calcium, and phosphorus levels and amylase activity7, 8.
In addition to glycemic control indicators, other parameters adequately reflect the intensity of pathological DM-related changes. Oxidative stress plays a central role in the destruction of pancreatic β-cells, resulting in the complete or near complete absence of insulin production in T1DM9. Recent studies have shown that both fasting and postprandial hyperglycemia cause the formation of glycation end-products. In addition, acute or chronic hyperglycemia and glycemic fluctuations induce oxidative stress9, which is associated with an increased risk of complications from DM. Oxidative stress in DM promotes the activation of heat shock proteins (HSPs), particularly HSP70. In cells, HSP70 exists in constitutive (73 kDa) and inducible (72 kDa) forms, which have chaperoning and anti-inflammatory activity10. Therefore, indicators of oxidative status and chaperone-like activity are important prognostic criteria for the development of DM and its complications.
Consequently, this study analyses the relationship between oxidative status indicators and carbohydrate and lipid metabolism in saliva and blood serum of T1DM patients.
Methods
Patient cohort
The study included patients hospitalized in the Endocrinology Department of the Voronezh Regional Clinical Center for Specialized Types of Medical Care (Voronezh, Russia). Informed consent was obtained from all participants before the research was conducted. All procedures involving human participants were performed in accordance with the ethical standards of the institutional and national research committee and with the 1964 Helsinki Declaration and its later amendments. This study was approved by the Ethics Committee of the Voronezh State Medical University named after N.N. Burdenko.
The experimental group comprised T1DM patients divided into two sex-based subgroups: 20 men (age 43.7 ± 3.21; mean ± standard error of the mean) and 20 women (42.05 ± 2.66). The control group consisted of ostensibly healthy individuals divided into two sex-based subgroups: 20 men (41.05 ± 3.54) and 20 women (43.35 ± 3.18). The sample size was chosen to achieve 80% power in statistical tests with an error rate of 0.0511. The object of the study was the mixed saliva and blood serum of healthy individuals and T1DM patients. The T1DM diagnosis was made according to clinical signs and biochemical blood tests.
Blood and saliva sampling
Saliva was collected from participants on an empty stomach in the morning, and they rinsed their mouths with clean water before the procedure. Mixed saliva was collected using a commercial saliva collection kit (D-51588; Sarstedt; Nümbrecht, Germany). The cotton swab used for saliva collection was kept in the mouth for 10 min, during which the donors sat, did not speak, and breathed through their noses. Mixed saliva samples were centrifuged at 3000 g for 10 min prior to analysis. Fasting blood samples were collected in the morning from the median cubital vein (vena mediana cubiti) and incubated at 37°C for 30 min before centrifugation at 3000 g for 10 min to isolate the serum ready for further analysis.
Determination of biochemical parameters in saliva and blood serum
The glucose oxidase method was used to quantitatively determine saliva glucose levels based on absorbance at 510 nm12. Protein concentrations in saliva samples were determined using the biuret reaction13. Total cholesterol concentrations in saliva samples were determined using the enzymatic colorimetric method14. Triglyceride concentrations in mixed saliva samples were determined using the enzymatic colorimetric method based on the hydrolysis of triglycerides into fatty acids and glycerol. Briefly, glycerol is converted into glycerol-3-phosphate and then dihydroxyacetone phosphate and hydrogen peroxide, which reacts with 4-chlorophenol and 4-aminophenazone to form a red-colored dye whose intensity is proportional to the triglyceride concentration in the sample15. Carbohydrate and lipid metabolism indicator concentrations in blood serum were determined using a Vitalit 1000 biochemical analyzer.
Assessment of oxidative status
Oxidative status was determined based on biochemiluminescence (BCL) parameters in saliva measured using a biochemiluminometer (BChL-07; Medozons; Nizhny Novgorod, Russia) and its associated software16. We measured the following parameters: the light sum (S), maximum flash intensity (Imax), reflecting the intensity of free radical-induced oxidation, and tangent of the BCL kinetic curve slope (tgα2), reflecting the total antioxidant activity.
Determination of chaperone-like activity
Chaperone-like activity in mixed saliva was quantified using a model test system based on insulin aggregation suppression. The kinetics of dithiothreitol- and temperature-induced (40°C) aggregation of insulin was measured using the turbidimetric assay. Aggregation was recorded using a Spekol 100 spectrocolorimeter (Carl Zeiss-Jena; Oberkochen, Germany) with a thermostated cuvette and an automatic recorder at 430 nm17.
Statistical analysis
Statistical data analyses were performed using mathematical and medical statistical methods with Microsoft Excel (Seattle, WA, USA) and STADIA 7.0 (InCo; Russia) software. Quantitative data are reported as mean ± standard error of the mean. The Kolmogorov-Smirnov one-sample test was used to assess the normality of variable distributions. Values were compared between groups using a Student’s t-test or Mann-Whitney U test. Pearson’s correlation coefficient test was used to assess the correlation between the blood serum and mixed saliva parameters. All results with p < 0.05 were considered statistically significant.
| Blood serum | ||||||
| Indicators | Control group | Patients with T1DM | ||||
| Subgroup 1 - men, n = 20 | Subgroup 2 – women, n = 20 | Subgroup 1 - men, n = 20 | Subgroup 2 – women, n = 20 | |||
| Glucose, mM | 5.278 ± 0.104 | 5.155 ± 0.105 | 10.190±0.536* | 9.425±0.658* | ||
| Cholesterol, mM | 4.547 ± 0.082 | 4.497 ± 0.085 | 5.190±0.157* | 5.225±0.160* | ||
| Triglycerides, mM | 1.021 ± 0.070 | 1.168 ± 0.054 | 1.584±0.083* | 1.413±0.071* | ||
| Total protein, g/L | 76.760 ± 0.922 | 74.580 ± 1.128 | 70.700±1.457* | 71.400±1.136 | ||
| Saliva | ||||||
| Indicators | Control group | Patients with T1DM | ||||
| Subgroup 1 - men, n = 20 | Subgroup 2 – women, n = 20 | Subgroup 1 - men, n = 20 | Subgroup 2 – women, n = 20 | |||
| Glucose, mM | 0.171 ± 0.002 | 0.171 ± 0.002 | 0.658 ± 0.009* | 0.679 ± 0.013* | ||
| Cholesterol, mM | 0.055 ± 0.005 | 0.055 ± 0.004 | 0.113 ± 0.005* | 0.117 ± 0.004* | ||
| Triglycerides, mM | 0.049 ± 0.004 | 0.051 ± 0.003 | 0.138 ± 0.008* | 0.136 ± 0.008* | ||
| Total protein, g/L | 3.774 ± 0.030 | 3.725 ± 0.031 | 4.627 ± 0.041* | 4.914 ± 0.040 *+ | ||
| Indicators | Control group | Patients with T1DM | ||
| Subgroup 1 - men, n = 20 | Subgroup 2 – women, n = 20 | Subgroup 1 - men, n = 20 | Subgroup 2 – women, n = 20 | |
| Chaperone-like activity, % of aggregation suppression | 13.310 ± 0.125 | 12.820 ± 0.609 | 23.500 ± 0.450* | 24.250 ± 0.361* |
| Imax BCL, mV | 111.0 ± 0.8 | 103.2 ± 0.8 + | 340.0 ± 2.5* | 396.9 ± 3.2 *+ |
| S BCL, mV*s | 687.2 ± 5.6 | 661.1 ± 5.0 + | 887.5 ± 6.2* | 908.5 ± 6.5 *+ |
| tgα2 BCL | 42.3 ± 0.3 | 40.2 ± 0.3 + | 172.2 ± 1.0* | 152.4 ± 1.1 *+ |

Results
The blood serum parameters of T1DM patients were consistent with their pathology. Their glucose concentration was significantly higher than control individuals (p < 0.05). The lipid spectrum in the blood serum of T1DM patients was characterized by increased total cholesterol and triglyceride concentrations compared with healthy individuals (p < 0.05). However, total protein content was significantly lower in the blood serum of men with T1DM (p < 0.05; Table 1). We also evaluated carbohydrate and lipid metabolism parameters in saliva. The biochemical composition of saliva in men and women with T1DM was characterized by significantly higher glucose, total protein, cholesterol, and triglycerides concentrations than in healthy individuals (p < 0.05).
Since oxidative stress plays a central role in T1DM pathogenesis, we assessed oxidative status parameters in saliva. Increased chaperone-like activity was found in the saliva of T1DM patients compared with healthy individuals (p < 0.05). In addition, the S and Imax BCL parameters were higher in the saliva of T1DM patients than in control individuals. Moreover, these parameters were significantly higher in women than in men with T1DM (p < 0.05; Table 2).
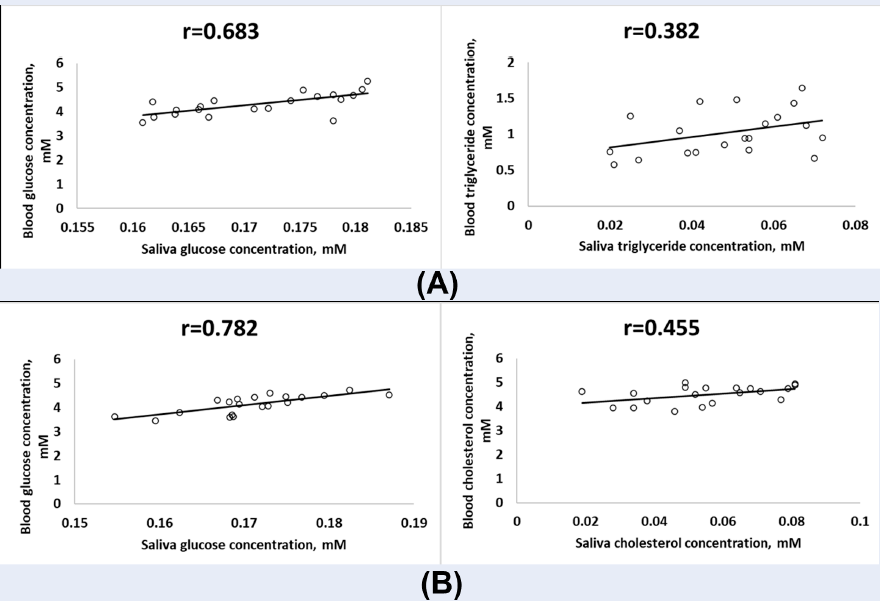
To assess the diagnostic potential of saliva with T1DM, we performed a correlation analysis between carbohydrate and lipid metabolism indicators in mixed saliva and blood serum of T1DM patients and assessed the relationships with oxidative status parameters. We found significant positive correlations between glucose, triglycerides, and cholesterol concentrations in the mixed saliva and the blood serum of T1DM patients (p < 0.05). In addition, a positive correlation was found between total protein content in serum and saliva in T1DM patients (Figure 1).
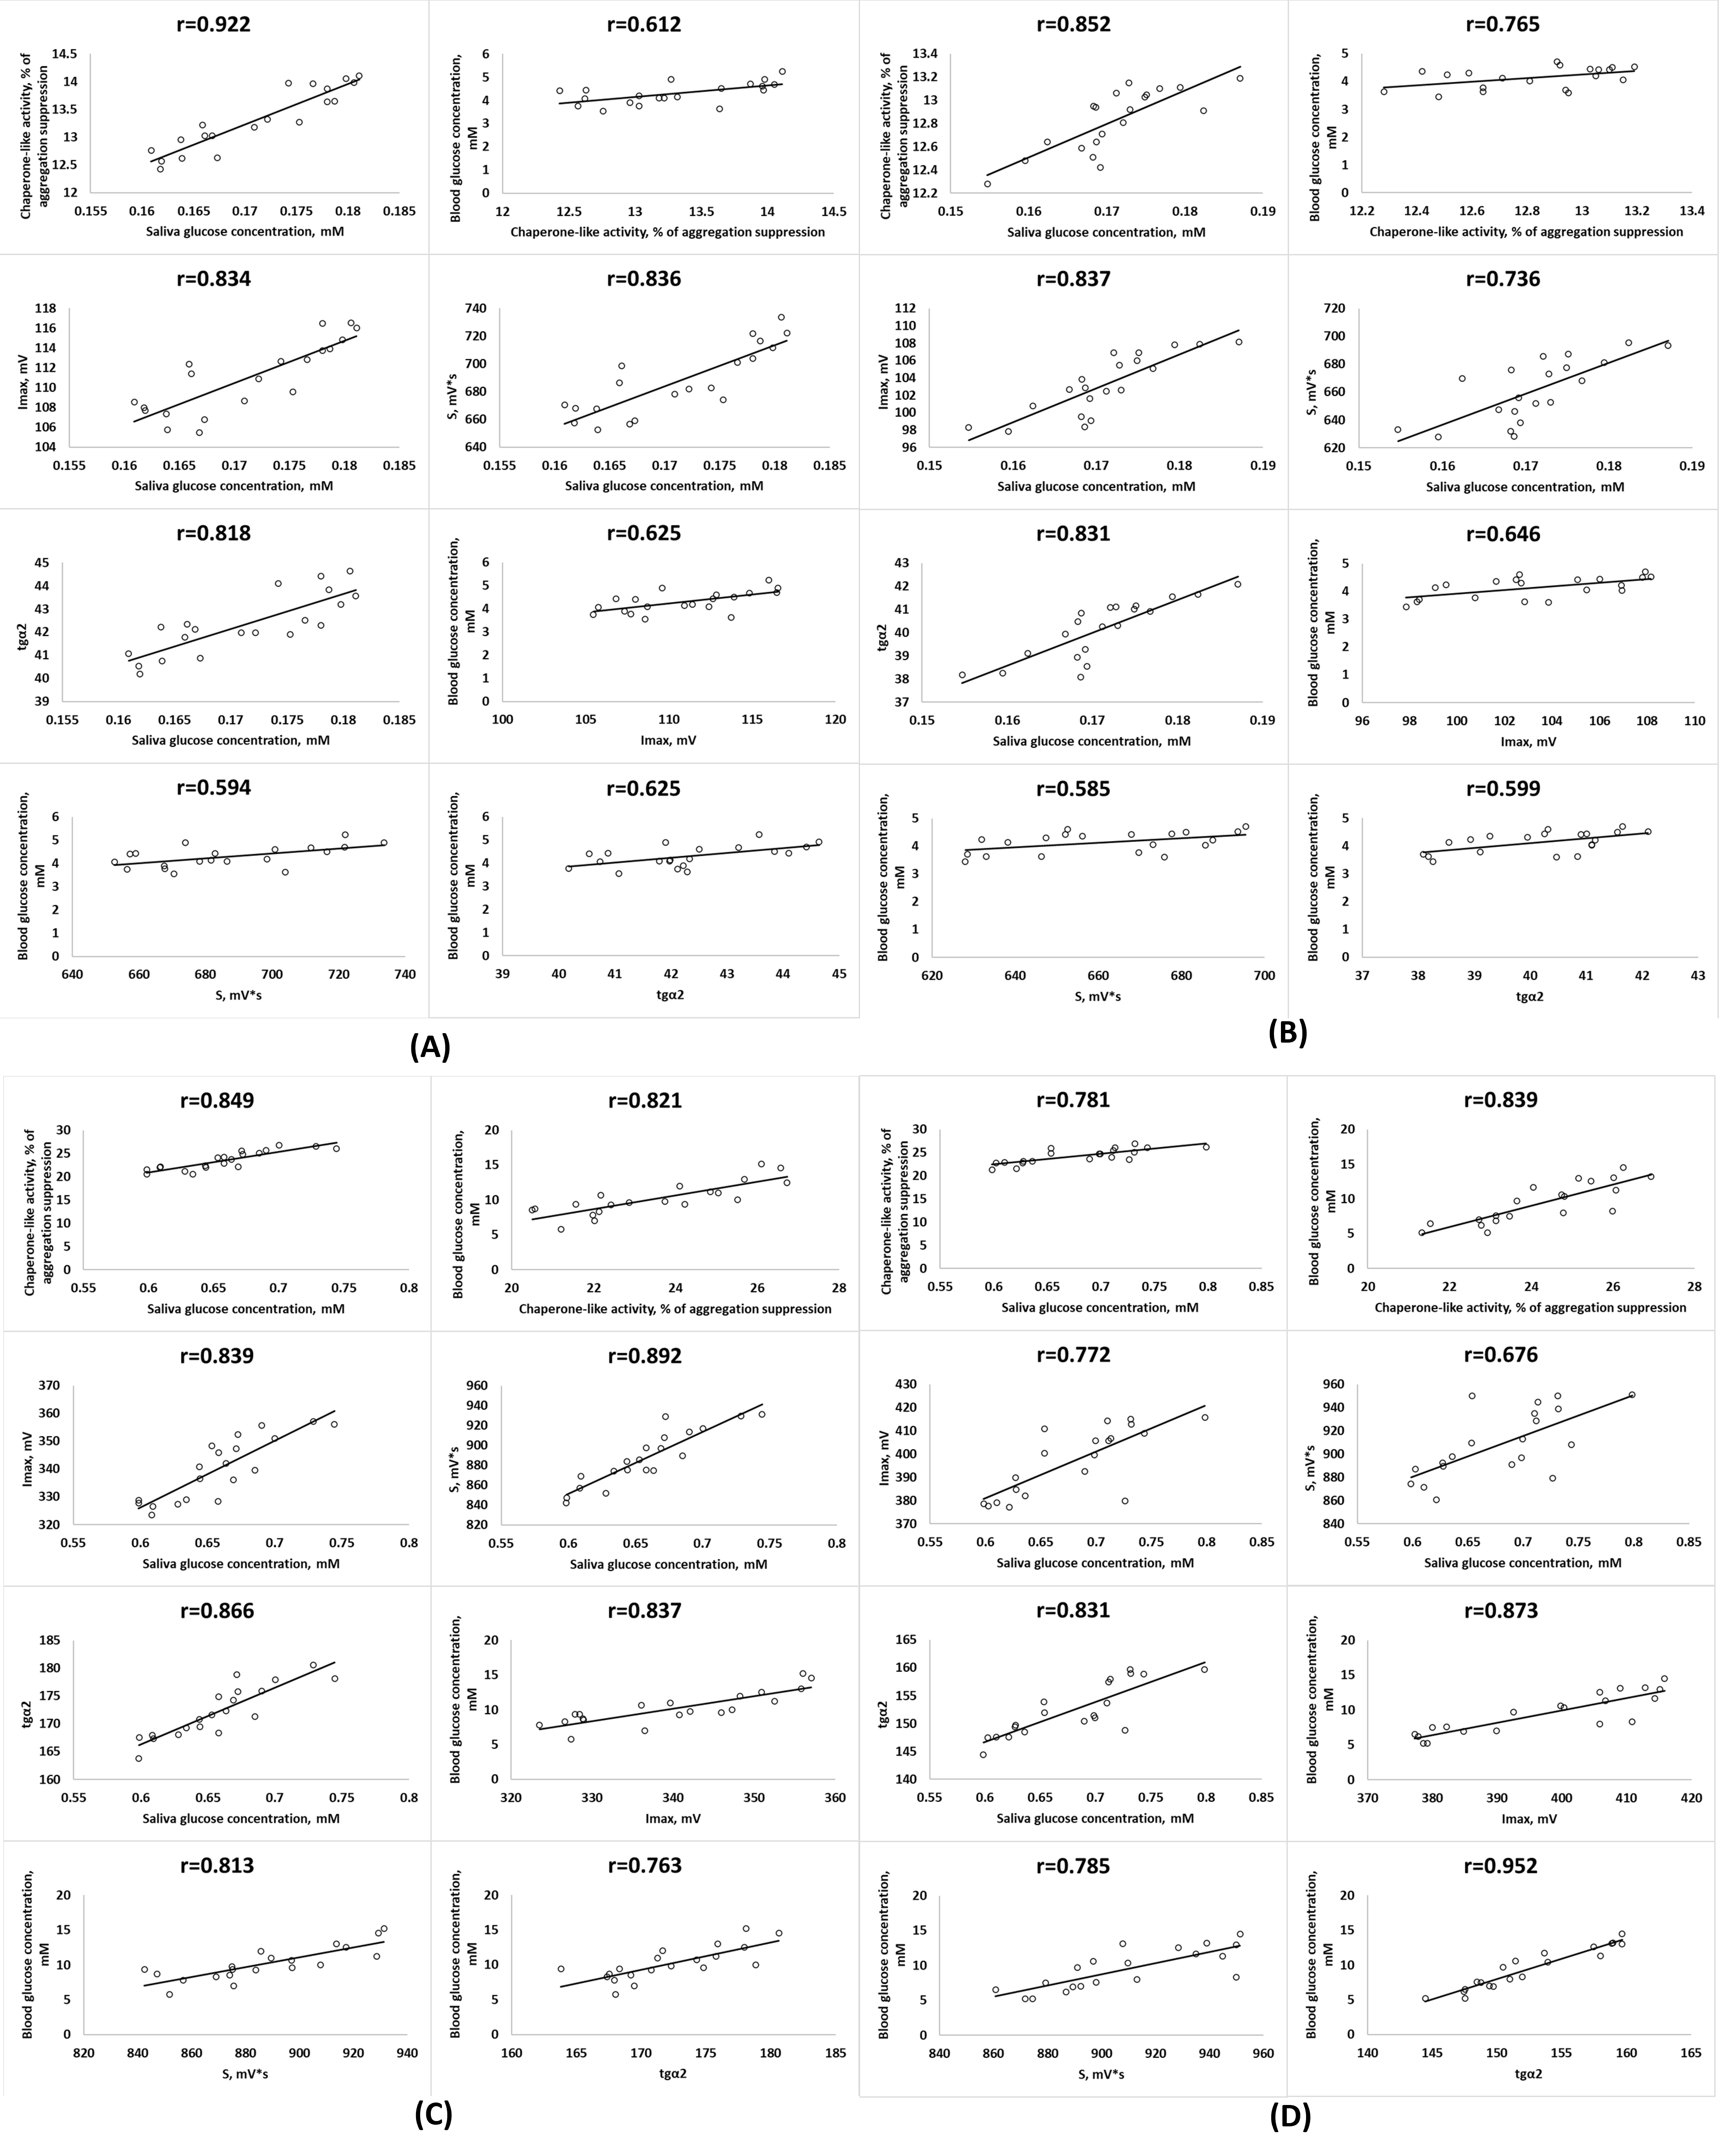
We also found a significant relationship between BCL parameters and chaperone-like activity in saliva and glucose concentration in the saliva and blood serum of T1DM patients (p < 0.05) and healthy individuals (Figure 2).
Discussion
Our results indicate a strong positive correlation between the glucose concentration in saliva and blood serum, consistent with its filtration through the BSB. Our findings are consistent with previous studies showing a correlation between fasting glucose and glycated hemoglobin levels in the serum and saliva of type 2 DM (T2DM) patients18. Similar results were found with serum and saliva glucose levels in T1DM patients19. Moreover, our study identified a relationship between lipid metabolism, oxidative status, and chaperone-like activity indicators in the blood serum and saliva of T1DM patients and healthy individuals.
Hyperglycemia is known to increase reactive oxygen species (ROS) production and lipid peroxidation product concentrations and lead to oxidative stress9, which are reflected in increased BCL mixed saliva parameters such as S and Imax. An increase in the BCL index tgα2 indicates a compensatory activation of the antioxidant system during T1DM development. The strong positive correlation we observed between the BCL parameters S and Imax in saliva and the concentration of glucose in serum and saliva reaffirms the role of hyperglycemia in oxidative damage and emphasizes the diagnostic value of saliva for assessing the oxidative status in DM patients. These findings contribute to current knowledge about oxidative stress marker levels in the saliva of DM patients. Indeed, in saliva, T1DM and T2DM patients were found to have significantly higher concentrations of 8-hydroxy-2′-deoxyguanosine and amino acid carbonyl residues than healthy individuals20.
Dyslipidemia is a well-known component of DM21, which was reaffirmed in this study by increased cholesterol and triglyceride levels in the blood serum and saliva T1DM patients. Hypertriglyceridemia in T1DM patients is associated with decreased uptake of very-low-density lipoprotein (VLDL) particles due to high insulin levels22. Another mechanism reducing triglyceride catabolism is the reduced lipoprotein lipase activity in muscle and adipose tissue, leading to decreased free fatty acid uptake and increasing serum free fatty acids that contribute to VLDL overproduction23, 24. The correlation found between glucose concentrations and cholesterol and triglyceride levels in serum and saliva indicates that the intensity of their transport in the saliva is determined by their plasma levels. Indeed, previous studies have shown that elevated cholesterol, triglycerides, low-density lipoprotein (LDL), and VLDL levels in the saliva of DM patients are risk factors for pathologies such as hypercholesterolemia and hyperlipidemia25.
An increase in chaperone-like activity was found in the mixed saliva of T1DM patients, an adaptive response to exogenous and endogenous damaging factors. The observed correlations indicate a relationship between chaperone-like activity and total protein and glucose levels in the blood serum and saliva of T1DM patients. It has been reported that hyperglycemia enhances the expression of small HSPs responsible for most chaperone activity26. In addition, methylglyoxal formed by glucose metabolism causes the modification of certain α-crystallin residues, changing its physicochemical properties and increasing its chaperone activity10.
This study has some limitations. Firstly, the sample size was too small to provide statistically significant correlations for all variables. Secondly, study participants were not pre-selected and may not be representative, limiting the extrapolatability of our findings. Thirdly, the T1DM people were not divided into subgroups based on the duration of the disease. Larger samples would have enabled the examination of correlations that depend on the duration of the disease.
Therefore, further studies with larger sample sizes categorized into subgroups based on age, T1DM duration, and the presence of complications are required. In addition, correlations between carbohydrate, lipid metabolism, and oxidative status parameters in T1DM patients undergoing standard treatment should be explored. Nevertheless, our findings may contribute to developing new approaches for monitoring T1DM treatment efficacy.
Conclusion
We have shown that carbohydrate and lipid metabolism indicators and oxidative status and chaperone-like activity parameters are altered in the mixed saliva of T1DM patients, indicating impaired metabolism in the oral cavity of patients with hyperglycemia. Changes in biochemical parameters in saliva correlated with changes in blood biochemical parameters in T1DM patients. Therefore, saliva can be used as a biomaterial for diagnosing T1DM and monitoring its treatment efficiency.
Abbreviations
BCL: biochemiluminescence, BSB: blood–saliva barrier, DM: diabetes mellitus, HSP: heat shock proteins, Imax: maximum flash intensity, ROS: reactive oxygen species, S: light sum, T1DM: diabetes mellitus type 1, tgα2: tangent of the biochemiluminescence kinetic curve slope.
Acknowledgments
None.
Author’s contributions
Cheprasova A.A. Patient recruitment, collection and processing of materials, laboratory studies, analysis of the data obtained, statistical analysis, publication preparation; Popov S.S. The concept and design of the study, the interpretation of the results, the writing of the text, the final approval of the manuscript; Pashkov A.N. Laboratory studies, the set of patients, analysis of the data obtained; Verevkin A.N. Laboratory studies, analysis of the data obtained; Kryl'skii E.D. Analysis of the data obtained, publication preparation; Mittova V.O. Analysis of the data obtained, publication preparation. All authors read and approved the final manuscript.
Funding
None.
Availability of data and materials
Data and materials used and/or analyzed during the current study are available from the corresponding author on reasonable request.
Ethics approval and consent to participate
This study was conducted in accordance with the amended Declaration of Helsinki. The research was approved by the Ethics Committee of the Voronezh State Medical University named after N.N. Burdenko.
Consent for publication
Not applicable.
Competing interests
The authors declare that they have no competing interests.
References
-
Shestakova
M.V.,
Vikulova
O.K.,
Zheleznyakova
A.V.,
Isakov
M.A.,
Dedov
I.I.,
Diabetes epidemiology in Russia: what has changed over the decade?. Therapeutic archive.
2019;
91
(10)
:
4-13
.
View Article Google Scholar -
Zak
K.P.,
Tron'ko
M.D.,
Popova
V.V.,
Butenko
A.K.,
Diabetes mellitus. Immunity. Cytokines. Кniga plus: Kyiv, 2015. 485 p..
.
-
Klimontov
V.V.,
Myakina
N.E.,
Variability of Glycemia in Diabetes Mellitus: Monograph, 2nd ed. INGU: Novosibirsk, 2018. 304 p. .
Google Scholar -
Popova
T.N.,
Rakhmanova
T.I.,
Popov
S.S.,
Medical Enzymology. VSU: Voronezh, 2008. 64 p. .
Google Scholar -
Kaczor-Urbanowicz
K.E.,
Martin Carreras-Presas
C.,
Aro
K.,
Tu
M.,
Garcia-Godoy
F.,
Wong
D.T.,
Saliva diagnostics - Current views and directions. Experimental Biology and Medicine (Maywood, N.J.).
2017;
242
(5)
:
459-72
.
View Article PubMed Google Scholar -
Mal
M.,
Noninvasive metabolic profiling for painless diagnosis of human diseases and disorders. Future Science OA.
2016;
2
(2)
.
View Article PubMed Google Scholar -
Ladgotra
A.,
Verma
P.,
Raj
S.S.,
Estimation of salivary and serum biomarkers in diabetic and non-diabetic patients - a comparative study. Journal of Clinical and Diagnostic Research : JCDR.
2016;
10
(6)
:
56-61
.
View Article PubMed Google Scholar -
Lakshmi
P.V.,
Sridevi
E.,
Sai Sankar
A.J.,
Manoj Kumar
M.G.,
Sridhar
M.,
Sujatha
B.,
Diagnostic perspective of saliva in insulin dependent diabetes mellitus children: an in vivo study. Contemporary Clinical Dentistry.
2015;
6
(4)
:
443-7
.
View Article PubMed Google Scholar -
Rodrigues
R.,
de Medeiros
L.A.,
Cunha
L.M.,
Garrote-Filho
M.D.,
Bernardino Neto
M.,
Jorge
P.T.,
Correlations of the glycemic variability with oxidative stress and erythrocytes membrane stability in patients with type 1 diabetes under intensive treatment. Diabetes Research and Clinical Practice.
2018;
144
:
153-60
.
View Article PubMed Google Scholar -
Nagaraj
R.H.,
Oya-Ito
T.,
Padayatti
P.S.,
Kumar
R.,
Mehta
S.,
West
K.,
Enhancement of chaperone function of α-crystallin by methylglyoxal modification. Biochemistry.
2003;
42
(36)
:
10746-55
.
View Article PubMed Google Scholar -
Julious
S.A.,
Sample sizes for clinical trials with normal data. Statistics in Medicine.
2004;
23
(12)
:
1921-86
.
View Article PubMed Google Scholar -
Raba
J.,
Mottola
H.A.,
Glucose Oxidase as an Analytical Reagent. Critical Reviews in Analytical Chemistry.
1995;
25
(1)
:
1-42
.
View Article Google Scholar -
Dianzani
M.U.,
Hepatotoxicology. In: Merks RG, Harison SD, Bull RI, editors. Biochemical aspects of fatty liver. Bocca Raton: CRC; 1991. pp. 327-399.
.
-
Allain
C.C.,
Poon
L.S.,
Chan
C.S.,
Richmond
W.,
Fu
P.C.,
Enzymatic determination of total serum cholesterol. Clinical Chemistry.
1974;
20
(4)
:
470-5
.
View Article PubMed Google Scholar -
McGowan
M.W.,
Artiss
J.D.,
Strandbergh
D.R.,
Zak
B.,
A peroxidase-coupled method for the colorimetric determination of serum triglycerides. Clinical Chemistry.
1983;
29
(3)
:
538-42
.
View Article PubMed Google Scholar -
Kryl'skii
E.D.,
Popova
T.N.,
Safonova
O.A.,
Stolyarova
A.O.,
Razuvaev
G.A.,
de Carvalho
M.A.,
Transcriptional regulation of antioxidant enzymes activity and modulation of oxidative stress by melatonin in rats under cerebral ischemia / reperfusion conditions. Neuroscience.
2019;
406
:
653-66
.
View Article PubMed Google Scholar -
Kurganov
B.I.,
Estimation of the activity of molecular chaperones in test-systems based on suppression of protein aggregation. Uspekhi Biologicheskoi Khimii.
2002;
42
:
89-138
.
-
Nagalaxmi
V.,
Priyanka
V.,
Saliva: can saliva be a marker for predicting Type 1 diabetes mellitus?-a pilot study. Journal of Indian Academy of Oral Medicine and Radiology.
2011;
23
(4)
:
579-82
.
View Article Google Scholar -
Satish
B.N.,
Srikala
P.,
Maharudrappa
B.,
Awanti
S.M.,
Kumar
P.,
Hugar
D.,
Saliva: A tool in assessing glucose levels in Diabetes Mellitus. Journal of International Oral Health : JIOH.
2014;
6
(2)
:
114-7
.
PubMed Google Scholar -
Su
H.,
Velly
A.M.,
Salah
M.H.,
Benarroch
M.,
Trifiro
M.,
Schipper
H.M.,
Altered redox homeostasis in human diabetes saliva. Journal of Oral Pathology & Medicine.
2012;
41
(3)
:
235-41
.
View Article PubMed Google Scholar -
Ginsberg
H.N.,
Zhang
Y.L.,
Hernandez-Ono
A.,
Regulation of plasma triglycerides in insulin resistance and diabetes. Archives of Medical Research.
2005;
36
(3)
:
232-40
.
View Article PubMed Google Scholar -
Hartz
J.C.,
de Ferranti
S.,
Gidding
S.,
Hypertriglyceridemia in Diabetes Mellitus: Implications for Pediatric Care. Journal of the Endocrine Society.
2018;
2
(6)
:
497-512
.
View Article PubMed Google Scholar -
Mohammad
J.A.,
Fathi
Z.H.,
Allwash
T.A.,
Assessment the effects of insulin on adiponectin, nitric oxide, myeloperoxidase and lipid profile in type 1 diabetic patients. Pharmacia..
2021;
68
(2)
:
313-9
.
View Article Google Scholar -
Adiels
M.,
Olofsson
S.O.,
Taskinen
M.R.,
Borén
J.,
Overproduction of very low-density lipoproteins is the hallmark of the dyslipidemia in the metabolic syndrome. Arteriosclerosis, Thrombosis, and Vascular Biology.
2008;
28
(7)
:
1225-36
.
View Article PubMed Google Scholar -
Shivanni
S.S.,
Vishnupriya
V.,
Analysis of lipid profile in saliva of diabetic patients - A pilot study. Journal of Pharmaceutical Sciences and Research.
2016;
8
(6)
:
477-9
.
-
Schlotterer
A.,
Kolibabka
M.,
Lin
J.,
Acunman
K.,
Dietrich
N.,
Sticht
C.,
Methylglyoxal induces retinopathy-type lesions in the absence of hyperglycemia: studies in a rat model. The FASEB Journal.
2019;
33
(3)
:
4141-53
.
View Article PubMed Google Scholar
Comments
Article Details
Volume & Issue : Vol 9 No 8 (2022)
Page No.: 5233-5240
Published on: 2022-08-31
Citations
Copyrights & License
This work is licensed under a Creative Commons Attribution 4.0 International License.
Search Panel
Pubmed
Google Scholar
Pubmed
Google Scholar
Pubmed
Google Scholar
Pubmed
Google Scholar
Pubmed
Google Scholar
Pubmed
Search for this article in:
Google Scholar
Researchgate
- HTML viewed - 4623 times
- PDF downloaded - 1504 times
- XML downloaded - 0 times
