

Copyrights: Sadaf Ali, Nivedita L. Rao, 2020. License: This work is licensed under a Creative Commons Attribution 4.0 International License.
Abstract
Introduction: Advanced glycation end products (AGEs) and diabetes duration have roles in the development of the vascular complications associated with morbidity and mortality in diabetic patients. The present study was conducted to estimate and find the association between serum fluorescence levels of advanced glycation products with diabetes duration and glycemic control in type 2 diabetic patients.
Methods: 46 patients who had diabetic duration of less than ten years and 49 patients with duration more than ten years were included in the study. Serum fluorescence of AGEs was measured using a simple spectrofluorometric method. Correlations of AGEs with diabetes duration, fasting glucose, and glycated hemoglobin levels were analyzed. The incidence of microvascular complications in patients of both groups was examined.
Results: Significantly higher serum fluorescent AGE levels (p < 0.001) and higher incidence of microvascular complications (p = 0.000) were found in diabetic patients who had diabetes duration of more than ten years, poorer glycemic control and higher age. Serum levels of fluorescent AGEs showed significant positive correlations with duration of diabetes mellitus, glycated haemoglobin and fasting glucose levels.
Conclusion: Screening patients for AGEs, intensive glycemic control, and therapeutic strategies that target molecular mechanisms involving advanced glycation end products are warranted in older patients with longer diabetes duration to minimize their risk of developing complications.
INTRODUCTION
Diabetes mellitus, a group of metabolic diseases characterized by hyperglycemia, is a major national and global public health problem. Current global estimates indicate that the disease has affected 463 million people and is set to escalate to 578 million by the year 20301. India has an estimated number of 77 million adults with diabetes, making India the second most affected country in the world after China1, 2. Morbidity and mortality associated with the disease are mainly due to the resulting microvascular and macrovascular complications3. Long-term damage, dysfunction, and failure of various organs are associated with chronic hyperglycemia of diabetes. Chronic microvascular complications of diabetes include retinopathy, nephropathy and neuropathy4, 5, 6. Diabetic retinopathy is a common microvascular complication of diabetes, estimated to be responsible for 10,000 new cases of blindness every year in the United States alone7. Chronic macrovascular complications of diabetes are cardiovascular diseases, as well as peripheral vascular and cerebrovascular diseases. Patients with diabetes are at 2-4 times increased risk of coronary heart disease, peripheral vascular disease, and related deaths than those in the general population8.
The impact of age, age at diagnosis of diabetes, and diabetes duration on subsequent vascular complications has been investigated in some studies but have yielded a variety of results. A positive association of older age on the risk of myocardial infarction and stroke has been reported in diabetic patients9. Independent effects of duration of diabetes and greater risks associated with early rather than late onset of diabetes have been reported10, 11. In patients with type 2 diabetes, current age, age at diagnosis, and diabetes duration were reported to be independently associated with macrovascular events and death. Diabetes duration was independently associated with microvascular events9. Long duration of diabetes, poor glycemic control, and hypertension reportedly increase the chances of microvascular complications of diabetes11. Poor glycemic control was associated with disease duration, hypercholesterolemia, high level of low-density lipoprotein, hypertension, and income level. Age was associated with the highest percentage of complications10.
Enhanced formation and accumulation of advanced glycation end products (AGEs) have been linked to increased risk for both macro- and micro-vascular complications of diabetes mellitus12, 13. Intense hyperglycemia elicited by diabetes leads to formation of Amadori products which through the Maillard reaction form AGEs, many of which have particular fluorescence14. Expression of receptors for advanced glycation end-products (RAGEs) gets accelerated consequently. Constant activation of the AGE-RAGE system creates long-term metabolic memory, accelerating oxidative stress in cells. Cytokines and growth factors secreted thereby cause inflammatory response or aggravate thrombotic tendency that leads to progression of arteriosclerosis and other vascular damages14, 15.
Although AGEs are understood to be key players in the development of chronic vascular complications in diabetic patients, very few studies have simultaneously investigated the associations of levels of AGEs, diabetes duration and glycemic control. One previous study reported that urinary fluorescent AGEs, years of diabetes and glycosylated/glycated hemoglobin (HbA1c) were found to be associated with the occurrence of microvascular complications, while serum fluorescent AGEs, years of diabetes and glycosylated hemoglobin were found to be associated with a number of complications16.
The present study was conducted to estimate and compare the serum fluorescence levels of AGEs in diabetic patients grouped according to the duration of diabetes mellitus. The association of AGEs with diabetes duration, indicators of glycemic control, fasting blood glucose (FBS), HbA1c levels, and incidence of microvascular complications in patients of both groups were compared. Knowledge of the associations would enable better cause-effect understanding of the resultant vascular complications in diabetic patients.
MATERIAL — METHODS
Patients
Ambulatory type 2 diabetic patients, on treatment with oral hypoglycemic drugs or on insulin, attending the Department of Medicine, Yenepoya Medical College Hospital, Mangalore, Karnataka, India were included in the study. Both admitted patients as well as outpatients, of age ranging from 39 years to 60 years, participated in the study.
Study design
Cross-sectional.
Exclusion criteria
Renal failure, uncompensated heart, pulmonary diseases, cancer and alcoholism.
Clinical history and examination
Detailed clinical history was taken from each patient about the diabetes duration, major macrovascular events or any other microvascular complications. Microvascular complications in the form of retinopathy and neuropathy were studied in the patients.
Study groups
Patients were divided into two groups on the basis of duration or length of diabetes mellitus.
Group 1 consisted of 46 patients whose diabetes duration ranged from 1 to 10 years.
Group 2 consisted of 49 patients who had more than 10 years of diabetes duration.
Blood samples
Fasting blood samples were collected.
Estimation of serum fluorescence of AGEs
Serum AGEs were measured by spectrofluorometry method16. Blood samples were centrifuged within two hours of drawing blood at 3000 rpm for 10-15 minutes. Then, 100 µl of serum was deproteinized with 300 µl of 5% trichloroacetic acid. Next, 200 µl of chloroform was added, vortexed for 60 seconds, and centrifuged at 14,000 rpm. The fluorescence intensity of supernatants was read at 440 nm after excitation at 355 nm using a Hitachi Spectrofluorometer. Results were expressed as arbitrary units per gram of serum protein (AU/g protein).
Estimations of fasting blood sugar, glycated hemoglobin and total proteins
Fasting blood sugar and total proteins were estimated by automated methods using VITROS 5600 integrated dry chemistry system located at the Yenepoya Central Diagnostic Laboratory (an NABL-accredited laboratory).
The D-10 Haemoglobin A1C instrumentation utilizing ion-exchange high performance liquid chromatography (HPLC) which is a gold standard, was used for the estimation of glycated haemoglobin (HbA1c).
Statistical analysis
The statistical tools used were independent t-test for comparison of means of both quantitative variables, chi-square test for proportion comparisons, and Pearson's correlation for finding associations. The statistical package used Statistical Package for Social Sciences (SPSS), version 22.
Results
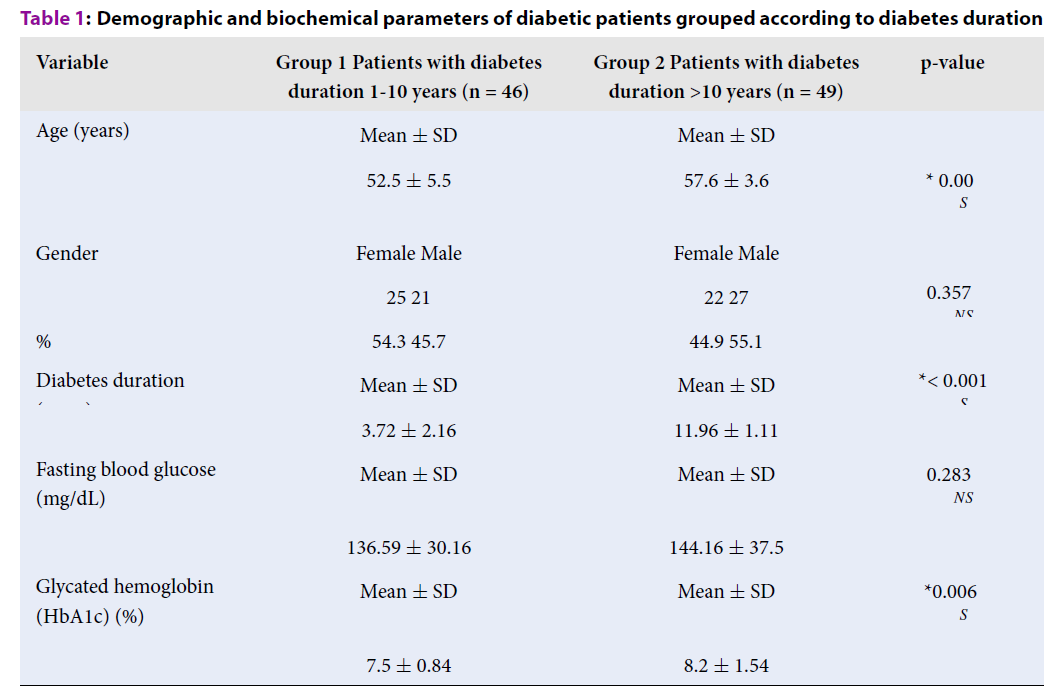
The mean age of patients was significantly higher in group 2; this group had a significantly longer diabetes duration than those in group 1. HbA1c values were also significantly higher in group 2, thus indicating poorer glycemic control in those patients. However, fasting blood sugar did not show any statistically significant difference between the two groups of patients. As well, there was no statistically significant gender difference between the two groups (Table 1).
| Variable | Group 1 Patients with diabetes duration 1-10 years (n = 46) | Group 2 Patients with diabetes duration >10 years (n = 49) | p-value |
| Age (years) | Mean ± SD | Mean ± SD | * 0.00S |
| 52.5 ± 5.5 | 57.6 ± 3.6 | ||
| Gender | Female Male | Female Male | |
| Number of patients | 25 21 | 22 27 | 0.357†NS |
| % | 54.3 45.7 | 44.9 55.1 | |
| Diabetes duration (years) | Mean ± SD | Mean ± SD | *< 0.001S |
| 3.72 ± 2.16 | 11.96 ± 1.11 | ||
| Fasting blood glucose (mg/dL) | Mean ± SD | Mean ± SD | 0.283†NS |
| 136.59 ± 30.16 | 144.16 ± 37.5 | ||
| Glycated hemoglobin (HbA1c) (%) | Mean ± SD | Mean ± SD | *0.006S |
| 7.5 ± 0.84 | 8.2 ± 1.54 |
The minimum duration of diabetes in patients was 1 year and the maximum was 15 years. Table 2 depicts the details of duration of diabetes in all patients included in the study. Although duration of 1-10 years in group 1 appears to be wide compared to group 2 (with duration of 10 – 15 years), the majority of patients in group 1 (38 out of total 46 patients) had diabetes duration of < 5 years (Table 2).
| Duration of diabetes in years | Number of patients | Percentage |
| 1-5 | 38 | 40 |
| > 5-10 | 08 | 8.4 |
| > 10-15 | 49 | 51.6 |
The number and percentage of diabetic patients with microvascular complications in the form of retinopathy or neuropathy were higher in group 2 patients, who had a longer diabetes duration (Table 3).
| Group 1 Patients with diabetes duration 1-10 years (n = 46) | Group 2 Patients with diabetes duration > 10 years (n = 49) | p -value | |
| Patients with microvascular complications: | |||
| Number | 3 | 23 | *0.000 |
| Incidence proportion | 6.5% | 47% |
Serum fluorescence levels of AGEs were significantly higher in group 2 patients who had a longer diabetes duration (Table 4).
| Group 1 Patients with diabetes duration 1-10 years (n = 46) | Group 2 Patients with diabetes duration >10 years (n = 49) | p - value | |
| Serum fluorescent AGEs (AU/g protein) | Mean ± SD | Mean ± SD | *< 0.001 |
| 1.77 ± 1.72 | 4.30 ± 3.2 |
The correlation between serum fluorescent AGEs with diabetes duration in all patients was analyzed. Serum fluorescence of AGEs for all diabetic patients showed a significant positive correlation with diabetes duration, fasting blood glucose (FBS) and glycated hemoglobin levels. The correlation of AGEs was strongest with HbA1c, which is evident from the r-value (Table 5).
| Number | AGE | Diabetes duration | FBS | HbA1c | ||
| AGE | 95 | *r | 1 | .558 | .447 | .726 |
| p | <.001 | <.001 | <.001 |
Serum fluorescent AGEs showed statistically significant positive correlations with diabetes duration, FBS and HbA1c in both groups of patients with diabetes duration of 1-10 years and > 10 years. However, in group 1 patients with diabetes duration 1-10 years, the correlation of AGEs was strongest with diabetes duration, which is evident from the r-value of 0.740 and p < 0.001, than with FBS or HbA1c. In group 2 patients with diabetes duration >10 years, the correlation of AGEs was strongest with HbA1c, which is evident from the r-value of 0.769 and p < 0.001 (Table 6).
| Serum fluorescent AGEs | ||
| Group 1 patients diabetes duration 1-10 years (n = 46) | Group 2 patients diabetes duration > 10 years (n = 49) | |
| Diabetes duration (years) | *r .740 p = 0.001 | *r .342 p < .016 |
| Fasting blood glucose (FBS) | *r .307 p = 0.038 | *r .513 p < .001 |
| Glycated hemoglobin (HbA1c) | *r .449 p = 0.002 | *r .769 p < .001 |
Discussion
Increased duration of diabetes mellitus has been reported to be associated with increased risk of diabetic vascular complications9, 11. AGEs are known to be involved in the development of microvascular complications12, 13, 14, 15. In the present study, serum fluorescence of AGEs was found to be significantly higher in group 2 patients with longer diabetes duration. The incidence of diabetic patients with microvascular complications (in the form of retinopathy and neuropathy) was also significantly higher in group 2 patients who had a longer diabetes duration. These results are similar to a previous report in which serum fluorescent AGEs, years of diabetes, and glycosylated hemoglobin were found to be variables associated with the number of microvascular complications in patients16.
In the present study, positive correlations of AGEs with diabetes duration, fasting blood glucose and glycated hemoglobin levels were found in both groups of patients. The correlation of AGEs with diabetes duration was stronger in patients with diabetes duration of 1-10 years. These results are different from a previous report in which serum fluorescent AGEs did not correlate with age, duration of diabetes, or glycosylated hemoglobin16. However, although patients with <4 years diabetes duration were excluded in that previous report, there is no data showing duration in years for those patients to compare with the present study16.
Compared to patients with diabetes of duration time 1-10 years, diabetic patients with duration time of > 10 years have significantly higher mean age, mean HbA1c levels (poorer glycemic control), and incidence of microvascular complications, as seen in the present study. These findings are consistent with previous reports9, 11. Diabetes duration was associated with risk of microvascular events even after adjustment for baseline HbA1c level. For each 5-year increase in diabetes duration, the multiple adjusted risk of microvascular events was increased by 28% in one previous report9.
People with diabetes duration of > 7 years were reported to be 6 times more likely to have complications in another previous study11. In the present study, the number of patients with diabetic microvascular complications were found to be 7.2 times more in patients with longer diabetes duration (of > 10 years) rather than those with shorter diabetes duration (of 1-10 years). The incidence proportions of patients with microvascular complications were compared between the two duration groups and found to be 47% and 6.5%, respectively (shown in Table 3).
In the present study, patients with diabetes duration of > 10 years had a higher age than patients with shorter diabetes duration. However, in a previous report, age did not have a separate effect on the risk of microvascular events9.
Unlike previous reports that examined the impact of duration on diabetic complications, the present study involved estimation of serum levels of fluorescent AGEs in conjunction with diabetes duration and glycemic control. AGEs comprise the link between diabetes disease as cause and effect of occurrence of microvascular complications. Toxic AGE (TAGE) formation inhibition, TAGE-RAGE interaction blockade, and RAGE expression suppression have all been reported as promising therapeutic targets against diabetic vascular complications17, 18.
Diabetic vascular complications are leading causes of end-stage renal failure, acquired blindness, a variety of neuropathies; cardiovascular diseases that cause morbidity and high mortality rates are suffered by diabetic patients. Estimating serum fluorescence levels of AGEs using the simple economical method used in the present study can effectively screen patients who may be at higher risk of developing diabetic microvascular complications and, thereby, enable better prevention of associated adverse outcomes.
CONCLUSIONS
Serum levels of fluorescent AGEs, the key molecules involved in development of diabetic vascular damage, have a positive correlation with the duration of diabetes mellitus, HbA1c and fasting glucose levels. Serum fluorescent AGE levels and incidence of microvascular complications are significantly higher in diabetic patients with longer diabetes duration, higher age and poorer glycemic control. Screening patients for fluorescent AGEs, intensive glycemic control and therapeutic strategies that target molecular mechanisms involving AGEs are warranted in older patients with longer diabetes duration to minimize their risk of microvascular complications.
Abbreviations
AGEs: Advanced glycation end products
RAGEs: Receptors for advanced glycation end-products
TAGE: Toxic Advanced glycation end products
HbA1c: Glycosylated/ Glycated hemoglobin
FBS: Fasting blood sugar/glucose
Acknowledgments
The authors of this study thank Dr. Ravi Vaswani, Professor, Dept of General Medicine, Yenepoya Medical College Hospital for helping in patient selection for the study. The authors also thank Ms. Megha, Statistician at Yenepoya (deemed to be University) for conducting statistical analysis of data.
Author’s contributions
Both authors made substantial contributions to conception, design, acquisition of data, analysis, interpretation of data; took part in drafting the article, revising it critically for intellectual content; approving the final version for publishing and agree to be accountable for all aspects of the work.
Funding
The present study was financially self- funded by the authors.
Availability of data and materials
Data and materials used and/or analyzed during the current study are available from the corresponding author on reasonable request.
Ethics approval and consent to participate
This study was conducted in accordance with the amended Declaration of Helsinki. Yenepoya Medical College Hospital was approved for this study, and all participants provided written informed consent.
Consent for publication
Not applicable.
Competing interests
The authors declare that they have no competing interests.
References
-
International Diabetes Federation. IDF Diabetes Atlas. 9th ed- Brussels, Belgium. 2019
.
View Article Google Scholar -
Whiting DR, Guariguata L, Weil C, Shaw J. IDF diabetes atlas: global estimates of the prevalence of diabetes for 2011 and 2030. Diabetes Research and Clinical Practice.
2011;
94
:
311-321
.
View Article PubMed Google Scholar -
Swerdlow AJ, Laing SP, Silva IS, Slater SD, Burden AC, Botha JL et al. Mortality of South Asian patients with insulin-treated diabetes mellitus in the United Kingdom: a cohort study. Diabetic Medicine.
2004;
21
(8)
:
845-851
.
View Article PubMed Google Scholar -
Ozougwu JC, Obimba KC, Belonwu CD, Unakalamba CB. The pathogenesis and pathophysiology of type 1 and type 2 diabetes mellitus. J. Physiol. Pathophysiol.
2013;
4
(4)
:
46-57
.
View Article Google Scholar -
Katakami N. Mechanism of development of atherosclerosis and cardiovascular disease in diabetes mellitus. J Atheroscler Thromb.
2018;
25
(1)
:
27-39
.
View Article PubMed Google Scholar -
Pitocco D, Tesauro M, Alessandro R, Ghirlanda G, Cardillo C. Oxidative Stress in Diabetes: Implications for Vascular and Other Complications. Int. J. Mol. Sci.
2013;
14
:
21525-21550
.
View Article PubMed Google Scholar -
Fowler MJ. Microvascular and Macrovascular Complications of Diabetes. Clinical Diabetes-Diabetes Foundation.
2008;
26
:
77-79
.
View Article Google Scholar -
Einarson TR, Acs A, Ludwig C, Panton UH. Prevalence of cardiovascular disease in type 2 diabetes: a systematic literature review of scientific evidence from across the world in 2007-2017. Cardiovasc Diabetol.
2018;
17
:
83
.
View Article PubMed Google Scholar -
Zoungas S, Woodward M, Li Q, Cooper M E, Hamet P, Harrap S et al. Impact of age, age at diagnosis and duration of diabetes on the risk of macrovascular and microvascular complications and death in type 2 diabetes. Diabetologia.
2014;
57
:
2465-2474
.
View Article PubMed Google Scholar -
Shamshirgaran SM, Mamaghanian A, Aliasgarzadeh A, Aiminisani N, Alamdari IM, Ataie J. Age differences in diabetes-related complications and glycemic control. BMC Endocrine Disorders.
2017;
17
:
25
.
View Article PubMed Google Scholar -
Ramnath SR. Correlation of duration, hypertension and glycemic control with microvascular complications of diabetes mellitus at a tertiary care hospital. Integrative Molecular Medicine.
2017;
4
(1)
:
1-4
.
View Article Google Scholar -
Sho-ichi, Kazuo N, Tsutomu I. Advanced Glycation End Products (AGEs) and Diabetic Vascular Complications. Current Diabetes Reviews.
2005;
1
:
93-106
.
View Article PubMed Google Scholar -
Zeinab H, Stephen G, Ludwig N, Mamas A. Role of advanced glycation end products in cardiovascular disease. World J Cardiol.
2012;
4
(4)
:
90-102
.
View Article PubMed Google Scholar -
Yamagishi S. Role of advanced glycation end products (AGEs) and receptor for AGEs (RAGE) in vascular damage in diabetes. Exp Gerontol.
2011;
46
:
217-224
.
View Article PubMed Google Scholar -
Rhee
S.Y.,
Kim
Y.S.,
The Role of Advanced Glycation End Products in Diabetic Vascular Complications. Diabetes Metab J.
2018;
42
:
188-195
.
View Article PubMed Google Scholar -
Maza MP, Garrido F, Escalante N, Leiva L, Barrera G, Schnitzler S et al. Fluorescent advanced glycation end-products (ages) detected by spectro-photofluorimetry, as a screening tool to detect diabetic micro vascular complications. J Diabetes Mellitus.
2012;
2
(2)
:
221-226
.
View Article Google Scholar -
Takeuchi M, Takino J, Yamagishi S. Involvement of the toxic AGEs (TAGE)-RAGE system in the pathogenesis of diabetic vascular complications: A novel therapeutic strategy. Curr Drug Targets.
2010;
11
(11)
:
1468-1482
.
View Article PubMed Google Scholar -
Pinkas A, Aschner M. Advanced Glycation End-Products and Their Receptors: Related Pathologies, Recent Therapeutic Strategies, and a Potential Model for Future Neurodegeneration Studies. Chem. Res. Toxico.
2016;
29
(5)
:
707-714
.
View Article PubMed Google Scholar
Comments
Downloads
Article Details
Volume & Issue : Vol 7 No 8 (2020)
Page No.: 3933-3938
Published on: 2020-08-31
Citations
Copyrights & License
This work is licensed under a Creative Commons Attribution 4.0 International License.
Search Panel
- HTML viewed - 6993 times
- Download PDF downloaded - 1981 times
- View Article downloaded - 0 times
