

The effect of vascular diseases on bioimpedance measurements: mathematical modeling
- Department of Biomedical Engneering, Faculty of Engineering, Helwan University, Egypt
Abstract
Introduction: The non-invasive nature of bioimpedance technique is the reason for the adoption of this technique in the wide field of bio-research. This technique is useful in the analysis of a variety of diseases and has many advantages. Cardiovascular diseases are the most dangerous diseases leading to death in many regions of the world. Vascular diseases are disorders that affect the arteries and veins. Most often, vascular diseases have greater impacts on the blood flow, either by narrowing or blocking the vessel lumen or by weakening the vessel wall. The most common vascular diseases are atherosclerosis, wall swelling (aneurysm), and occlusion. Atherosclerosis is a disease caused by the deposition of plaques on the inner vessel wall, while a mural aneurysm is formed as a result of wall weakness. The main objective of this study was to investigate the effects of vascular diseases on vessel impedance. Furthermore, this study aimed to develop the measurement of vessel abnormalities as a novel method based on the bioimpedance phenomenon.
Methods: Mathematical models were presented to describe the impedance of vessels in different vascular cases. In addition, a 3D model of blood vessels was simulated by COMSOL MULTIPHYSICS.5, and the impedance was measured at each vascular condition.
Results: The simulation results clarify that the vascular disorders (stenosis, blockage or aneurysm) have significant impact on the vessel impedance, and thus they can be detected by using the bio-impedance analysis. Moreover, using frequencies in KHz range is preferred in detecting vascular diseases since it has the ability to differentiate between the healthy and diseased blood vessel. Finally, the results can be improved by selecting an appropriate electrodes configuration for analysis.
Conclusion: From this work, it can be concluded that bioimpedance analysis (BIA) has the ability to detect vascular diseases. Furthermore, the proposed mathematical models are successful at describing different cases of vascular disorders.
Background
The cardiovascular system consists of the heart, which is the central unit, the vessels, and blood. Its main functions are transporting blood, which carry essential substances, throughout the body. It also removes products and wastes produced from cellular metabolism. The cardiovascular system is closed, as the blood flows from the heart to every region of the body and back again [1].
Blood vessels are classified mainly as veins, arteries, and capillaries. All blood vessels basically consist of lumen (where the blood can flow) and wall [2]. In atherosclerosis, the lumen area is narrowed due to the formation of deposits on the vessel wall. These deposits may be made of cholesterol, macrophages, calcium, or other substances from the blood. Sometimes, the deposits grow to a certain size and stop growing, causing no problems. However, sometimes, the deposits grow and block the lumen, leading to many health problems [3].
The weakness in vessel wall causes the wall to be swollen and form aneurysms. These aneurysms may be formed in any blood vessel. Small ones are not dangerous but at their severe stages, some aneurysms can rupture, leading to internal bleeding [4]. In diagnosing vascular diseases, imaging techniques and ankle-brachial index are the most commonly used techniques which require complex instruments and, thus, the continuous presence of a trained operator [5].
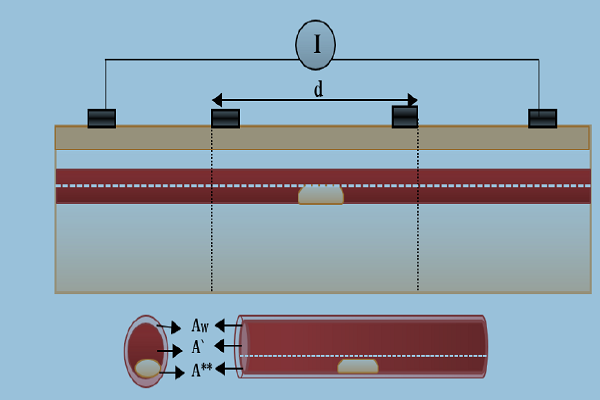
Bioimpedance analysis (BIA) has been recently used for diagnosing several diseases since it is non-invasive, simple for users, and does not require a trained operator [6]. In BIA, weak AC current (I) is applied by two electrodes and the produced voltage (V) is measured by the same electrodes or by another two electrodes to calculate the impedance. In tetrapolar electrodes, two electrodes which are called “current electrodes” supply the current, while the two other electrodes are called “voltage sensing electrodes”, and are used for voltage measurements, as shown in Figure 1 [7].

Tetrapolar configuration of electrodes
The main objective of this research study was to investigate the effects of vascular diseases on vessel impedance. Herein, we present mathematical models to describe different vascular conditions. These conditions are normal vessels without any disorders, vessels with mural plaques, and vessels with wall aneurysms.
Moreover, a finite element model of the blood vessel and surrounding tissues was constructed and simulated. The blood vessel was modeled in the case of normal; thereafter, the mural plaques and aneurysms of different sizes and locations were added to the vessel. At each case, the model was simulated and the impedance was measured across the sensing electrodes. These measurements were carried out using three different frequencies (50 KHz, 100 MHz, and 1GHz), to determine the best frequency capable of detecting the vascular diseases.
Finally, the results were extracted and discussed to demonstrate:
- The ability of mathematical models in describing different vascular disorders, and their impact on the measured bioimpedance.
- The ability of BIA in detecting vascular diseases.
Mathematical Algorithms
In this part, mathematical models were suggested to describe different cases of vascular disorders. Firstly, the general impedance law was described by equations (1) to (3) below [8],
Where:
Y is the admittance.
Z is the impedance (reciprocal of admittance).
G and C are conductance and capacitance.
A and L are area and length.
σ(f ), ∈ (f ) and ∈0 are the electrical conductivity, relative permittivity, and vacuum permittivity.

Equation 1

Equation 2

Equation 3
Secondly, mathematical models were suggested to describe the vessel impedance in three medical cases: normal case, stenosis case, and swelling (aneurysm) case.
Normal Case
Figure 2 illustrates a simplified model of blood vessels in normal conditions (no disorders). This model represents the blood vessel as concentric cylinders of vessel and blood that form a circuit of impedances in parallel when applying an electric current; this model was previously proposed [9].

Illustration of a normal blood vessel and surrounding tissues
The impedances of the vessel wall (Zw) and blood (ZB ) are described in (4) and (5), with the assumption that the length of the segment being measured by electrodes is (d), that and are the electrical conductivity of wall and blood, and also that and are the electrical permittivities of the wall and blood. ZN.V is the impedance of blood vessel in the normal case.

Equation 4

Equation 5

Equation 6
For applying non-invasive vascular diagnosis, the impedance of the tissues must be added. In this case, the measured impedance by electrodes is called (Z‘N ) and estimated in equation (7), where ZT i is the impedance of the tissues (skin, muscle, fat, and bone).

Equation 7
Due to the random distribution of current and current attenuation, an error (E1) is produced and equation (7) is modified to:

Equation 8
Stenosis Case
In the abnormal case (formation of deposits), a simplified model of blood vessel was described in Figure 3 . In this case, the blood area was decreased from AB to A‘ and so the blood impedance was increased to Z‘B as presented in (9). Equation (10) presents the impedance of deposit and its surrounding blood with area A**, where L, σ, and ∈ are the length, electrical conductivity, and electrical permittivity of deposit.

Illustration of an abnormal blood vessel with a mural plaque

Equation 9

Equation 10
In this case, the impedance of blood vessel was called ZS.V , and the measured impedance by electrodes was estimated in (12), with addition of error (E2).

Equation 11

Equation 12
Mural deposits with different sizes and locations are presented in Figure 4 :

Differentsizes and locations of mural deposits
In Figure 4a , the long deposit is presented. The electrodes can estimate approximately the impedance of length (d) of the deposit. Equation (10) becomes:

Equation 13
In Figure 4b , a part of the deposit is located outside the measured length by electrodes. Thus, equation (10) becomes:

Equation 14
In Figure 4c , all deposit sizes are located outside the measured length by electrodes. Thus, the electrodes cannot measure the deposit impedance ZD=0. In this case, the measured impedance is nearly equal to the vessel impedance in the normal case. Equation (10) becomes:

Equation 15

Equation 16
Equations (9) to (12) clarify that the presence of deposits increases vessel impedance and, thus, the measured impedance by electrodes. From equations (13) to (16), it is expected that the sensing electrodes can almost measure the impedance of deposits which are located between them.
Aneurysm Case
In the abnormal case (presence of aneurysm), a simplified model of blood vessels is shown in Figure 5 . In this case, the aneurysm and its adhesive tissue are assumed to form area A and their impedance Z, neglecting the change in vessel area due to aneurysm formation. The other tissue has impedance Z*, electrical conductivity t, and permittivity t. An aneurysm is filled with blood and has the same electrical properties of blood and length (L). Z is the measured impedance by electrodes in the aneurysm case:

Illustration of an abnormal blood vessel with a muralaneurysm

Equation 17

Equation 18
Aneurysms of different sizes and locations are presented in Figure 6 :

Differentsizes and locations of a wall aneurysm
In Figure 6a , a long aneurysm is presented. The electrodes estimate nearly the impedance of length (d) of the aneurysm.

Equation 19
Figure 6b , a part of the aneurysm is located outside the measured segment by electrodes.

Equation 20
Figure 6c , all the aneurysms are located outside the measured segment. Thus, the electrodes cannot estimate the aneurysm impedance.

Equation 21

Equation 22
The stated equations clarify that the presence of an aneurysm decreases the vessel impedance and, thus, the measured impedance by electrodes. From equations (19) to (22), it is expected that the electrodes can approximately estimate the impedance of the aneurysm parts which are located between them.
Materials and Methods
In this section, 3D modeling of a blood vessel was simulated by COMSOL MULTIPHYSICS.5, and the impedance was measured at different vascular cases.
In model geometry, the simplified forearm model was constructed. The forearm was constructed as structures containing five components (i.e. skin, fat, muscle, bone and blood vessel). The taken length was 100 mm, as shown in Figure 7 . The thicknesses of skin, fat and muscles were 3 mm, 10 mm and 25 mm, respectively, and the bone diameter was 2 cm. The radiuses of blood and wall were 1.5 mm and 1.7 mm, respectively [10][11].

The constructed COMSOL model of the human forearm
A tetrapolar configuration of copper electrodes was used; the outer two electrodes supplied current with values (1 mA) and the inner pair (A & B) were used as voltage sensing electrodes. The inter-electrode spacing was 25-10-25 mm. The dimensions of the sensing electrodes were
5x10x1 mm3 and cover 20 mm from the forearm length, as illustrated in Figure 7 .
Figure 7 shows the blood vessel in the normal case when the vessel is located under the skin.
Two different vascular disorders were studied using this model, as shown in Figure 8 .

Blood vessel with: a) plaque, or b) wall aneurysm.
Figure 8a displays the vessel with mural plaque; this plaque shape was studied at different heights (from 0.5 mm to 3 mm) and lengths (from 2 mm to 20 mm). In Figure Figure 8b , wall swelling was presented with different heights (from 0.5 mm to 4 mm) and lengths (from 2 mm to 20 mm). The center of the plaque or aneurysm was located at Z=50 mm.
In “single impedance measurement”, the voltage electrodes ‘A&B’ were positioned from Z=40 mm to Z=60 mm.
In “multi-segment impedance measurements”, the voltage electrodes ‘A&B’ were positioned firstly from Z=15 mm to Z=35 mm, and then moved with each 5 mm step until they reached Z= 65 mm & Z=85 mm; the impedance was measured with each movement.
Three different frequencies (50 KHz, 100 MHz, and 1GHz) have been used in modeling simulations. The dielectric properties of tissues have been defined by Gabriel et al. (1996), as shown in Table 1 [12] . The blood flow is assumed to be laminar and blood density is 1060 and viscosity is 0.005 Pa.s [13].

The dielectric properties of tissues at 50 KHz,100 MHz, and 1 GHz
In meshing, the ‘finer’ element size is used to increase the model effectiveness in detecting the vascular disorders, as shown in Figure 9 .

Mesh setting
Finally, the simulation was executed and the impedance was measured across the voltage electrodes at different vascular cases using different frequencies. In the next section, the simulation results will be represented and discussed.
Results
Current uniformity
Figure 10 displays the distribution of electric potential over whole forearm layers. The red arrows represent the current flow between the current electrodes.

Electric potential and current density
Figure 10 shows that the ‘distant’ current electrodes produce uniform current than ‘near’ current electrodes and the current can flow through a larger volume, reaching to deeper vessels. Consequently, the ‘distant’ current electrodes were chosen in this study to verify the passage of current within the blood vessel and guarantee uniform current.
Measured impedances
In this section, various studies were applied to find the most suitable frequency and configurations of electrodes for detecting vascular diseases. Different cases of vascular diseases were studied and the impedance was measured for each case.
(i) Stenosis Case
In this category, the influence of plaques on the measured impedance was presented using different plaque sizes. The frequencies used were 50 KHz, 100 MHz, and 1 GHz. The mural plaques were presented in two major cases as the following: first case- fatty plaque with length 20 mm and height (from 0.5mm to 3mm); second case- fatty plaque with height 1 mm and length (from 2 mm to 20 mm), as shown in Figure 11 . The plaque center was at (Z=50mm), which is located between the two voltage electrodes. Figure 11 shows the relation between (ZS / ZN ) and plaque size, where ZN and ZS are the measured impedances in the normal and plaque cases.

The measured impedances at: a) different plaque heights, or b) different plaque lengths
From Figure 11 , the impedance was in direct relation with deposit size; this means that an increase in deposit size increases the impedance value. In the case of deposits of 3 mm height, the vessel was blocked, resulting in many diseases. Figure 11 also clarifies that 50 KHz frequency was able to detect vascular stenosis more frequently than the other two frequencies. In the case of vessels with 3 mm plaque height, the impedance values were increased by (60%, 30%, and 22%) for (50 KHz, 100 MHz and 1GHz), respectively. For vessel with 20 mm plaque length and 1 mm height, the impedance values were increased by (22%, 15%, and 10%) for (50 KHz, 100 MHz, and 1GHz), respectively.
(ii) Aneurysm Case
In this category, the effect of mural aneurysms on the measured impedances was presented using different aneurysm sizes. The aneurysms were presented in two major cases as the following: first case- a saccular aneurysm with length 20 mm and height (from 0.5 mm to 4 mm); and second case- a saccular aneurysm with height 1 mm and length (from 2 mm to 20 mm). Also, the aneurysm center was located between the two sensing voltage electrodes at Z=50 mm. Figure 12 shows the relation between (ZA / ZN ) and plaque size, where ZN and ZA are the measured impedances in the normal and aneurysm cases.

The measured impedance at: a) different aneurysm heights; and b) different aneurysm lengths
Figure 12 indicates that the relation between the measured impedance and the aneurysm size was negative linear. Also, Figure 12 clarifies that 50 KHz frequency was able to detect the aneurysms more often than the other two frequencies. In the case of vessels with 4 mm aneurysm height, the impedance values were decreased by (60%, 26.6%, and 22%) for (50 KHz, 100 MHz, and 1GHz), respectively. For vessels with 20 mm aneurysm length and 1 mm height, the impedance values were decreased by (15%, 8%, and 6%) for (50 KHz, 100 MHz, and 1GHz), respectively.
(iii) Blood Flow Impedance
In this part, the effect of blood flow on the measured impedance was studied in the normal, wall swelling, and stenosis cases.
Figure 13 shows no effect of blood flow on the measured impedances in all vascular cases. It is well-known that the frequency of the heartbeat and, therefore, the blood pulsation is about 1 Hz. Hence, current with frequencies (50 KHz, 100 MHz or 1GHz) is high enough to consider the blood as a stationary object.

The impedance of blood flow
(iv) Blood Electrode Configuration and Dimension
The objective of this section was to study different configurations and dimensions for the voltage sensing electrodes to explore their impact on bioimpedance measurements. The internal distance between the two electrodes was tested from 2 cm to 6 cm, as presented in Figure 14 . Moreover, the electrode width was tested from 1 mm to 8 mm, and length from 2 mm to 15 mm, as illustrated in Figure 15 and Figure 16 .

Electrodes with different internal distances

Electrodes with different lengths

Electrodes with different widths
This study uses two small deposits and aneurysms with lengths 5 mm and heights 1 mm, and 50 KHz frequency.
From Figure 14 , if the internal distance between the voltage sensing electrodes was within 2 cm or lower, the results were better, since the electrodes could scan accurately each vessel part and detect the infected site. From Figure 15 , it is clear that the suitable electrode length lies between 4 mm to 15 mm. Figure 16 also shows that the suitable electrode width is between 4 mm to 10 mm. As concluded from Figure 14 and Figure 15 , and Figure 16 , the suitable electrodes have 10 mm length, 5 mm width, with 2 cm internal distance.
Segmental Impedance Measurements
Using mobile sensing electrodes, the two voltage electrodes were moved to the investigative part and the impedance was measured at each movement. The voltage electrodes ‘A&B’ were positioned firstly (from Z=15 mm to Z=35 mm), and their position was changed with each 5 mm step until it reached Z= 65 mm & (‘&’ or ‘to’ ??) Z=85 mm. Four plaques with lengths (2, 6, 12, and 25 mm) and heights (1 mm, 2 mm, and 3 mm) were studied individually, where the center of the plaque was located at Z=50 mm. Likewise, four aneurysms were studied, as presented in Figure 17 and Figure 18 .

The movement of electrodes on blood vessel containing plaque

The movement of electrodes on blood vessel containing aneurysm
The simulation results of segmental impedance measurements were presented in Figure 19 , Figure 20 , Figure 21 and Figure 22 .

The measured impedance of blood vessel with: a) plaque length of 2 mm; b) plaque length of 6 mm

The measured impedance of vessel with: a) plaque length of 12 mm; b) plaque length of 25 mm

The measured impedance of vessel with: a) aneurysm length of 2 mm; b) aneurysm length of 6 mm

The measured impedance of vessel with: a) aneurysm length of 12 mm; b) aneurysm length of 25 mm
From Figure 19 , Figure 20 , Figure 21 and Figure 22 , the location of the aneurysm or plaque, relative to the position of sensing electrodes, has a greater effect on the measured impedance. In case of plaque, the maximum impedance was obtained only when all plaques were located between the two sensing electrodes. Thereafter, the impedance begins to be decreased when a segment of plaque is placed outside the measured volume by electrodes. As the plaque is located away from the sensing electrodes, the presence of plaque has an ignored effect on the measured impedance.
In the case of wall aneurysm, the impedance is minimum when all aneurysms are located between the two sensing electrodes. Then, the impedance starts to increase when a part of the aneurysm is placed exterior to the electrodes. As the aneurysm is situated away from the sensing electrodes, the presence of the aneurysm has approximately no effect on vessel impedance.
In the case of plaque or aneurysm with 25 mm length, the measured impedance is related to length 20 mm only because the two electrodes cover a length of 20 mm.
Discussion
In detecting vascular diseases, the imaging techniques and ankle-brachial index are the most used techniques. These techniques require complex and expensive instruments, and the continuous presence of a trained operator. In this study, the possibility of using the bioimpedance analysis (BIA) in detecting different vascular diseases was discussed. As it is a non-invasive, low cost, and simple analysis, and one that does not need a trained operator, it presents many benefits.
In recent years, BIA has become a popular modality in detecting various body diseases (e.g. blood analysis and cancer detection), in chest measurements (e.g. impedance cardiography), and in imaging [14]. There are a wide range of bioimpedance utilizations to estimate and evaluate the vascular states. In a study by Al-Harosh and Shchukin (2017) [15], the electrical impedance method was used in peripheral vein detection by applying a known alternating current of frequency (100 KHz) and measuring the resulting potential. Anand et al. (2016) [10] also applied measurements on human forearm within a frequency range of 1 KHz to 2 MHz; these measurements were done at three instances of radial artery diameter to mimic the condition of blood flow.
In invasive measurement, Stiles et al. (2003) [16] had constructed a finite element model to determine the feasibility of characterizing various types of atherosclerotic lesions in vivo. This was accomplished by simulating two electrodes which were attached to an angioplasty balloon in the coronary artery and measuring the impedance of type III, IV, Va, and Vb lesions. The simulation results showed that the lesions near the electrodes had a greater effect on the measured impedance; also, the four lesions types could be distinguished.
In non-invasive measurements, Ben Salah et al. (2015) [17] had performed several investigations in the field of diagnosis of cardiovascular diseases using the bioimpedance method. New techniques have been suggested in evaluating several hemodynamic parameters, such as cardiac output, stroke volume, aortic compliance, and cardiac index. Moreover, Anderson et al. (1984) [18] had presented a review of a theoretical basis and clinical application of bioimpedance plethysmography in the evaluation of peripheral vascular diseases. However, the accuracy of bioimpedance plethysmography was poor, especially in detecting small plaque sizes since the signals might contain motion artifacts and the flow could not be completely blocked, resulting in incorrect analysis. Moreover, the limb was modelled as a uniform cylinder and the vascular expansion was assumed to be uniform. This assumption was probably true only for healthy vessels, but not for diseased vessels. Also, the diagnosis procedures included long occlusion time (>2 min), causing a change in blood properties due to the decrement in oxygen saturation.
In other previously published studies, some authors studied vascular diseases and their effects on the mechanical properties of blood vessels, e.g. Vallez et al. (2015) [19]. These effects or changes would be reflected as a change in the electrical properties of the blood vessels.
Herein, we conducted a study to evaluate the possibility of detecting vascular diseases using BIA. In this study, mathematical models and finite elements models were developed to describe the vessel impedance for different medical conditions. Furthermore, this study was developed to estimate different vascular disorders non-invasively as a novel method, based on the bioimpedance phenomena. Various studies were applied to find the suitable frequency and electrode configurations for detecting the vascular diseases. To verify the passage of current within the blood vessel and guarantee the current uniformity, ‘distance current electrodes’ were recommended to be used. In the case of voltage electrodes, their length must be appropriate for the vessel diameter, whereas electrodes with small length cannot cover the full vessel diameter and, thus, their abilities to detect vascular disorders are reduced. Moreover, the results were improved by decreasing the internal distance between the voltage electrodes.
The simulation results demonstrate that the preferred frequency is 50 KHz, as it can detect the vascular diseases better than the other frequencies in the MHz or GHz range. This frequency (50 KHz) is characterized by high penetration depth and high efficiency to pass through intracellular and extracellular fluids. Moreover, it is high enough compared with the frequency of the heartbeat to consider the blood particles as stationary objects [14].
From the measured impedances, the presence of mural plaques impedes the blood flow and the increase in deposit height increases the probability of blocking the vessel. Also, it should be noted that the presence of deposits with any size increases vessel impedance and, thus, the measured impedance by electrodes. This what has been concluded before based on equation 9 to equation 12, whereas the presence of deposit decreases the blood area and increases vessel impedance. On the contrary, the presence of wall swelling (aneurysm) decreases the measured impedance, as it increases the blood volume (in the area of interest) and decreases its impedance, thus, vessel impedance. This is what has been deduced by equations 17 to 18.
The location of the aneurysm or plaque, relative to the position of the sensing electrodes, has a greater effect on the impedance. In the case of plaque, the maximum impedance is obtained only when all plaque sizes are located between the two sensing electrodes. Thereafter, the impedance begins to be decreased when a segment of plaque is situated outside the sensing electrodes. When all plaques are located away from the sensing electrodes, the presence of the plaque has an ignored effect on the measured impedance and, thus the value Z/Z is approximately equal to 1. These conclusions correspond to equations 13 to 16.
In vessels with mural aneurysms, the impedance has the smallest values when aneurysms of all sizes are located between the two voltage electrodes. Thereafter, the impedance is increased when the electrodes are moved further from the aneurysm, but the value ZA/ZN remains less than 1. When the aneurysm is located near the outside of the covered length by electrodes, the presence of the aneurysm has an ignored effect on the measured impedance and, thus, the value Z/Z is approximately equal to 1. These deductions correspond to equations 19 to 22.
Conclusion
This research presents the usage of bioimpedance technique in detecting vascular diseases. Mathematical models were suggested to describe the vessel impedance under different medical conditions. Also, the finite element model of the blood vessel with different disorders was constructed and simulated, and the results were extracted and compared with the mathematical models.
The mathematical models were successful at representing the vascular diseases, as the presence of any disorders (plaque, block, or aneurysm) could change the vessel impedance and, therefore, the measured impedance by the electrodes. This clarifies the ability of BIA in detecting vascular disorders and estimating their kinds and sizes.
Using frequencies in KHz range is preferable to be used in detecting the changes in vessel impedance because it has the ability to differentiate between normal and diseased blood vessels.
Open Access
This article is distributed under the terms of the Creative Commons Attribution License (CC- BY4.0) which permits any use, distribution, and reproduction in any medium, provided the original author(s) and the source are credited.
List of abbreviations
BIA: bio impedance analysis
Ethics approval and consent to participate
Not to be applied
Competing interests
The authors declare that they have no conflicts of interest.
Funding
Not be applied
Authors’ contributions
All Authors participated in drafting the article and revising it, also they all gave a final approval of the version to be submitted.