

Copyrights: Luan Huu Huynh, Phuong Thi-Kim Bui, Thanh Thi-Ngoc Nguyen, Hue Thi Nguyen, 2017. License: This work is licensed under a Creative Commons Attribution 4.0 International License.
Abstract
Introduction: Breast cancer is the one of the most common types of cancer as well as the second leading cause of cancer death in women in the world. In recent studies, microRNAs (miRNAs) have been demonstrated to play a crucial role as a new potential biomarker in the association with breast cancer. Single Nucleotide Polymorphisms (SNPs) located on specific miRNA may result in breast cancer. Among the SNPs, SNP rs353291 has shown to be associated with breast cancer in individuals of Caucasian background. Furthermore, this SNP is observed in a high percentage of mutant alleles in the Vietnamese population. Thus, SNP rs353291 was selected as a candidate SNP for investigation in this study. The frequency of SNP rs353291 was evaluated by High Resolution Melting (HRM) method, which is a highly powerful method to detect variants in DNA sequence, especially for SNP genotyping.
Methods: In this study, the association between this SNP and risk of breast cancer in the Vietnamese population was evaluated in 90 cases and 96 healthy controls via genotyping using an optimized HRM protocol.
Result: The genotyping results revealed that SNP rs353291 is a polymorphism in the Vietnamese population. We have successfully identified frequencies of AA, AG and GG to be 40%, 42.2% and 17.8%, respectively. In particular, the calculated frequencies of allele G was 61.1% while risk allele A was 38.9%. The association between this SNP and breast cancer in Vietnam revealed that there is an obvious decreased risk of breast cancer among Vietnamese population when comparing G allele to A allele (G vs A: OR=0.92, 95% CI: 0.62-1.36, p= 0.677); the results also showed that heterozygote model had a reduced risk of breast cancer compared to dominant model (GA+GG vs AA: OR=0.94, 95% CI: 0.52-1.70, p=0.839).
Conclusion: However, since the p-values were >0.05, our results only show a correlation rather than a significant association between SNP rs353291 and breast cancer risk in the Vietnamese population.
Introduction
Breast cancer is not only one of the most common cancers in women but also the leading cause of cancer death of women worldwide. In 2012, it was reported that new cases of breast cancer reached up to nearly 1.7 million and that breast cancer had become the second most common cancer overall GLOBOCAN, 2012, especially in developing countries. According to Globocan that year, among the seven countries of South-Eastern Asia, Vietnam had a high incidence rate comprising 23 percent Trieu et al., 2015. Moreover, according to the Association of Cancer in Ho Chi Minh City in 2012, 30 out of 100,000 women in Hanoi are affected by this deadly cancer, while the ratio in Ho Chi Minh City was 20 out of 100,000 women Association of Cancer. Therefore, these statistics demonstrated that breast cancer was increasing at an alarming rate; it not only had become a prominent cancer in women worldwide (next to cervical cancer) but also more prevalent among women in Vietnam.
The role of microRNAs (miRNAs) has recently been studied due to their potential role as biomarkers for various types of cancer, including breast cancer Bertoli et al., 2015Kong et al., 2012Takahashi et al., 2015van Schooneveld et al., 2015. microRNAs belong to a large family of small (approximately 20–22 nucleotides), non-coding RNAs that regulate the expression of target genes by targeting mRNAs to trigger either translational repression or mRNA degradation Takahashi et al., 2015. Indeed, miRNAs take part in almost all biological processes such as apoptosis, cell growth and differentiation; this is due to their direct targeted effect on human mRNA Jovanovic and Hengartner, 2006. It has been demonstrated that the activities of miRNAs play an important role in cell-to-cell communication and role as therapeutic and diagnostic markers Takahashi et al., 2015.
Single Nucleotide Polymorphisms (SNPs) are the most abundant variant in human genome. They can affect the function of various genes when they appear within a gene or in a regulatory region near a gene. Most SNPs within miRNA sequences or their target sites have been found to be associated with many kinds of cancers Song and Chen, 2011. There have been numerous investigations into the function and influence of certain SNPs located on certain miRNA region and their effects on breast cancer pathway Chen et al., 2014O'Day and Lal, 2010Onay et al., 2006Qi et al., 2015. Among these potential SNPs, SNP rs353291 may have an association with breast cancer on miRNA 143 host gene transcript (miR143HG).
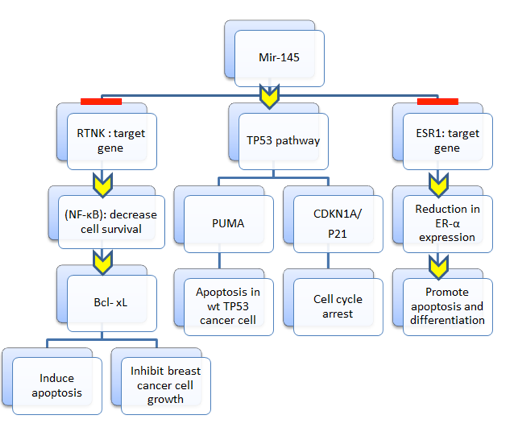
SNP rs353291 is located 450 bp upstream from the miR145 gene located inside the miR143HG (in the long arm of chromosome 5 region 32 at position 148,810,746). MiR143HG is the gene region which consists of miR143 and miR145. SNP rs353291 may play an important role in the expression of miR145, leading to abnormal activities of miR145. MiR145 is shown to take part in TP53 pathway which controls the regulation of estrogen receptor-α and death-promoting signals in breast cancer cells. The advancement of the apoptotic process of wild-type TP53-expressing and ER-α-positive breast cancer cells is mediated by tumor suppressor activity of MiR145. The expression of MiR145 not only triggers TP53 activation but also restrains ER-α, resulting in the positive regulatory death loop which leads to re-expression of miR145 in breast cancer patients Spizzo et al., 2010. Moreover, miR145 can inhibit breast cancer cell growth through RTKN. RTKN is considered as another target of miR145; it is known as a coding gene and potential marker for identification of breast cancer cells. It is expressed in low amount in normal cells but at high levels in cancer cell lines. In cells, resistance to apoptosis plays a significant role in tumorigenesis Wang et al., 2009. Thus, from all the evidence above, it can be assumed that miR145 could be a promising target for the treatment of breast cancer since it is a potent tumor suppressor that can regulate multiple cellular pathways, as described in Figure 1 Cui et al., 2014Kim et al., 2011Trieu et al., 2015Vuong et al., 2010Zhang et al., 2013.
Previously, there has been some evidence showing that SNP rs353291 has an association with breast cancer Chacon-Cortes et al., 2015. It was demonstrated that this SNP had a close relationship with an increased risk of developing breast cancer in individuals of Australian Caucasian background in two independent case control cohorts (p=0.041 and p=0.023). Since the Vietnamese population is distinct from other populations, our current study seeks to analyze the correlation between SNP rs353291 and breast cancer in Vietnamese women.
The High-Resolution Melting (HRM) method is a powerful one for SNP genotyping and, thus, was applied in this study. This method allows researchers to rapidly determine and accurately genotype genetic variants with a large number of samples in a short time. It is a measurement of fluorescence change accompanied by double strand DNA melting using a saturated DNA-intercalating dye. It characterizes nucleic acid samples based on their melting behavior. Hence, different genotypes in PCR products are detectable because this method changes the shape of DNA melting curves. It is massively cost-effective, due to low-cost dyes and less optimization time, compared to other genotyping technologies, such as sequencing or Taqman SNP typing. In addition, since this method is closed-tube no processing is required between amplification and analysis, thus errors and contamination are highly avoidable (Premier Biosoft).
This study was aimed to analyze the correlation between SNP rs353291 and the risk of breast cancer in Vietnamese women. The study was accomplished using an optimized HRM method.
Materials - Methods
Sample preparation
The population of interest in this study was the Vietnamese population. Blood samples were collected from the Oncology Hospital, Ho Chi Minh City. The sample population included 100 cases and 100 healthy controls. The group of healthy controls were derived from healthy people. All the cases were diagnosed with breast cancer by the Oncology Hospital and prepared for surgery, and were eligible to participate in the study. The blood samples were collected, based on the required criteria that they were from female individuals who belonged to the Vietnamese-Kinh population. All patients were given consent forms to sign and study approval was obtained from the Ethical Committee of the Oncology Hospital, HCMC, Vietnam (under the decision number 177/HĐĐĐ-CĐT, granted the 18th of November, 2014). The collected blood samples were stored in tubes containing EDTA at -20°C until use.
Collected blood was stored in 2 mL-tubes containing EDTA so as to prevent anti-coagulation; samples were transferred from the Oncology Hospital laboratory and transferred to our laboratory within 24 hours. The blood samples were frozen at -80oC until DNA extraction was performed. Samples from cases were to be compared to those from healthy controls. DNA from blood samples was extracted by salting-out method followed by a protocol by Hue et al. Hue et al., 2012. In this protocol, white blood cells were isolated from whole blood by centrifugation and then cell lysis buffer (Tris HCl-10mM, sucrose-11%, MgCl2-5mM, and Triton X100-1%) was added to lyse and release cellular components. Next, pellets were treated with 300 µL of nuclei lysis buffer (Tris HCl-10mM, TmTS-1%, EDTA-10mM, and sodium citrate-10mM) to lyse the nuclei and release DNA. After that, the DNA was separated from other components and cell debris by adding aqueous phase using 500 μL of chloroform. The upper aqueous phase containing DNA was then transferred to a new 1.5ml micro-centrifuge tube. The DNA was precipitated out of the solution using absolute ethanol and 100 μL of NaCl-5M, followed by ethanol-70%. All aforementioned reagents were obtained from Thermo Fisher Scientific Waltham, MA, USA). The supernatant was discarded and the precipitated DNA was kept overnight for drying. Finally, the dried and clear DNA was dissolved in molecular water or RNAse-free water and then stored in -20oC for further use. After the extraction, DNA samples were measured by absorbance in a NanoDrop 1000 Spectrophotometer (Thermo Scientific, USA).DNA purity was determined by calculating the ratio of absorbance at 260 nm to absorbance at 280 nm. The A260/A280 ratio in the range of 1.7-2 was considered high purity DNA for HRM analysis.
Primer design
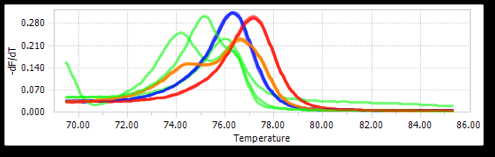
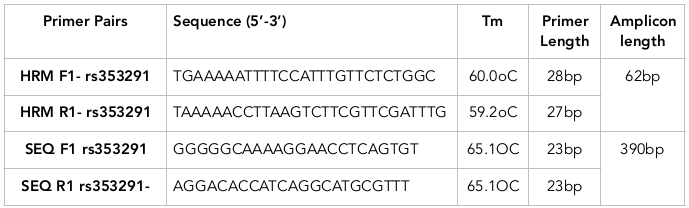
SNP rs353291 is located 450 bp upstream from the MIR145 gene, in the intron region of the long arm of chromosome 5 at position 148,810,746. The sequence of SNP rs353291 was identified using Gene Bank database. The sequence and other information related to this SNP were obtained from NCBI. The online tool Primer3plus was applied to design a specific pair of primers (Primer3plus). One set of primers for HRM analysis was designed by Primer3plus with the following required criteria: product size of HRM primer from 80 – 150 bp and sequencing primer from 300-400bp, size 18 – 27 bp, temperature of melting (Tm) of primers around 60 – 70°C (65°C is optimal), and difference in Melting Temperature of Forward primer and Reverse primer not allowed to exceed 3°C. After that, the specificity of the primers was tested by NCBI Blast (NCBI BLAST) and UCSC in-silico PCR (UCSC In silico pcr), to limit any undesired PCR product. To eliminate secondary structure, Oligo Analyzer online tool (Oligo Analyzer) was used. The pairs of primers which had the highest specificity were then used to predict the HRM melting curves of their amplicons using UmeltHet (UmeltHets). The best primer pair should yield products with 3 distinct curves and peaks for the 3 genotypes GG, AA and GA. Adjustments would be made for components such as [Mg2+] (mM) and % DMSO. “Very High – 0.1°C” resolution was used to achieve the best distinguished melting curves representing each genotype. Beside the primers for HRM analysis, an extra pair of primers for sequencing (to confirm genotypes of three positive control samples) was also designed.
Genotyping method optimization
Three stages of optimization of HRM analysis were conducted: initial optimization, control findings and final optimization. PCR thermal cycling was set up as: denaturation at 94°C for 60s; annealing temperature (Ta) for 30 sec and extension step set at 72°C for 10 min. PCR cycles were repeated 40 times.
For initial optimization, Ta optimization was performed in range 58°C -72°C using thermal cycle PCR Eppendorf instrument (Eppendorf, Germany) and TopTaq Master Mix Kit (Qiagen. The optimization step was carried out by using Thermal cycle PCR Eppendorf instrument and TopTaq Master Mix kit (Qiagen, Germany). Total volume of each PCR reaction was 25 µL, which includes 1X Toptaq Master Mix, 0.2 µM of each primer, 10ng of DNA, and molecular-grade water. A negative control was included in each assay. After that, the PCR products were run on a 2% electrophoresis gel for 20 minutes at 80 V.
For the positive control identification step, since this genotyping method requires positive controls, some samples were selected randomly to perform HRM reactions at the previous optimized Ta. Components of each reaction included: 1X PCR buffer, 200 µM of each deoxynucleotide triphosphate (dNTP), 2.0 mM MgCl2, 0.2 µM forward primer, 0.2 µM reverse primer, 2.5 units of HotstarTaq, 10 ng of DNA, and molecular water. The different melting curve groups were considered as having different genotypes. After that, three possible genotype samples were selected for the sequencing. The three genotypes of SNP rs2853826 (AA, AG, and GG) were expected to have three positive controls.
For post optimization of MgCl2, as three controls were determined, optimization had to be conducted again in order to obtain the clustered and distinct melting curves of the three controls together. To test the differences between theory obtained by Umelt Hets software and reality, the post optimization for MgCl2 was required to estimate the best condition for the HRM reaction. Gradient MgCl2 concentrations (from 1.5-3.5 mM) were evaluated.
Genotyping
Finally, the optimal HRM conditions were applied to the 100 breast cancer samples and 100 healthy controls for genotyping. For each running time, three positive controls and one negative control were included in the plate. The results were analyzed using LightCycler® 96 SW 1.1 software (Roche, Swiss). The samples with identified genotype(s) then were proceeded to the next step (calculation for genotypic frequency).
Statistical analysis
The Hardy-Weinberg equilibrium (HWE) in controls was analyzed. P <0.05 was considered representative of departure from HWE. To determine whether the SNP frequency in cases and controls were significantly different, allele and genotype frequencies were compared using Chi-square test. Furthermore, OR with 95% CI was used to assess the strength of association between rs353291 and Vietnamese patients.
Results
Primer designFour pairs of primers had been selected based on strict criteria by Primer3Plus and the predicted melting curves by UmeltHets. As a result, the pair of HRM primers (HRM F1, HRM R1) and Sequencing primers (SEQ F1, SEQ R1) satisfied the requirement of the HRM analysis ( Table 1 , Figure 2 ). Specificity of this primer pair was checked carefully on NCBI Blast and showed high specificity; on Oligo Analyzer the primer pair showed very weak secondary structure formation (∆G >-1).
Initial optimization
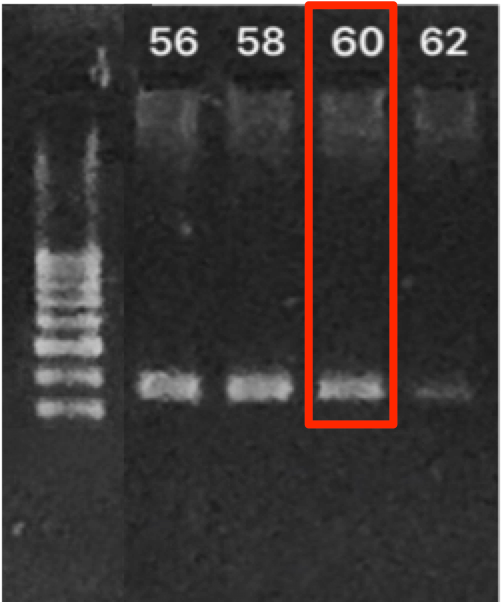
Ta is known as the most important criterion of HRM method since it affects HRM through PCR amplification. The gradient range of Ta ranged from 56°C to 66°C. In Figure 3 , there were only 4 bands that appeared at the temperature of 56°C, 58°C, 60°C, and 62°C. However, the brightest band in Ta=62 was not consistent on multiple gels so we could not set Ta =62 as optimal temperature. As Ta was increased in the range from 64°C to 66°C, the PCR products were not shown. Therefore, 60°C was considered to be the most ideal Ta for the PCR assay because lower temperatures might potentially cause the primers to anneal, which would then result in more non-specific products. Moreover, it was noted that there may be a borderline between success and failure to amplify the products of this SNP at 62°C. In addition, there was no extra band on the gel, which confirms the high specificity of the primer sets.
Identification of positive controls by sequencing
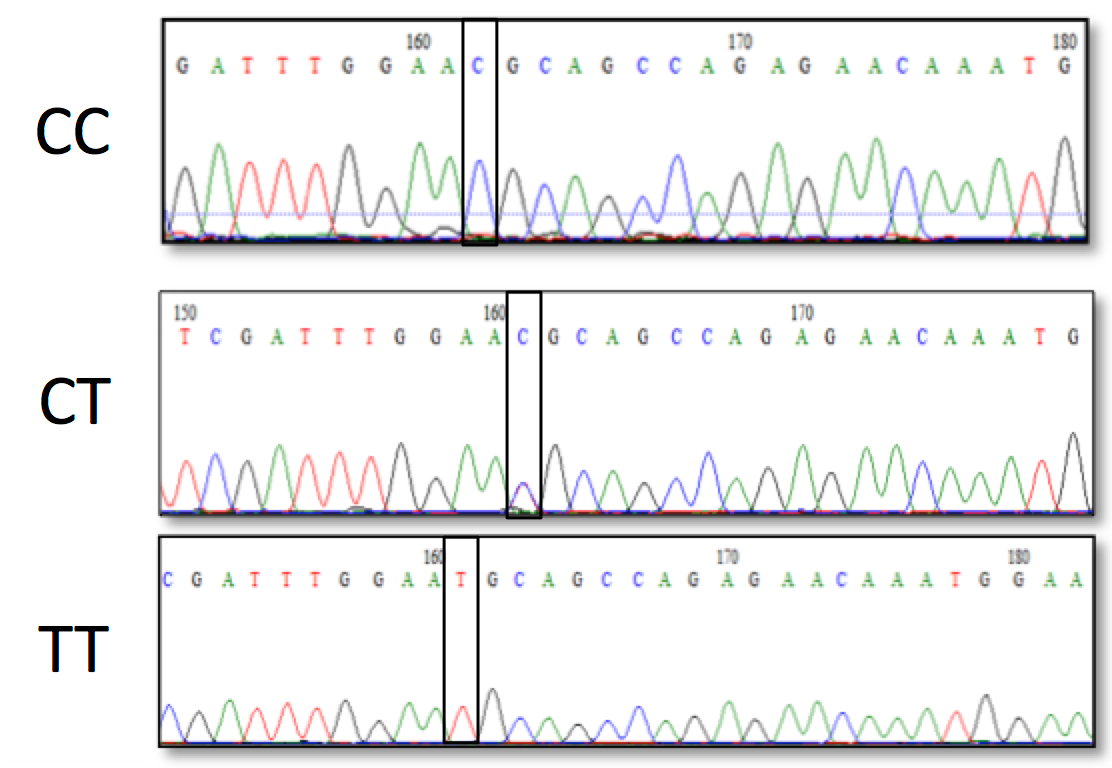
The main purpose of this step was to identify 3 control samples for the 3 different genotypes: homozygote wild-typed (AA), heterozygote mutant (GA) and homozygote mutant (GG). Eight random samples were chosen to be analyzed by HRM. The assay was performed under conditions of 3.0 mM MgCl2 and optimal Ta of 600C. As a result, 8 samples were separated into three groups; one sample represented each group of curve pattern, and then all were subjected to sequencing to determine genotype ( Figure 4 ).
Optimization of Ta sequencing primer
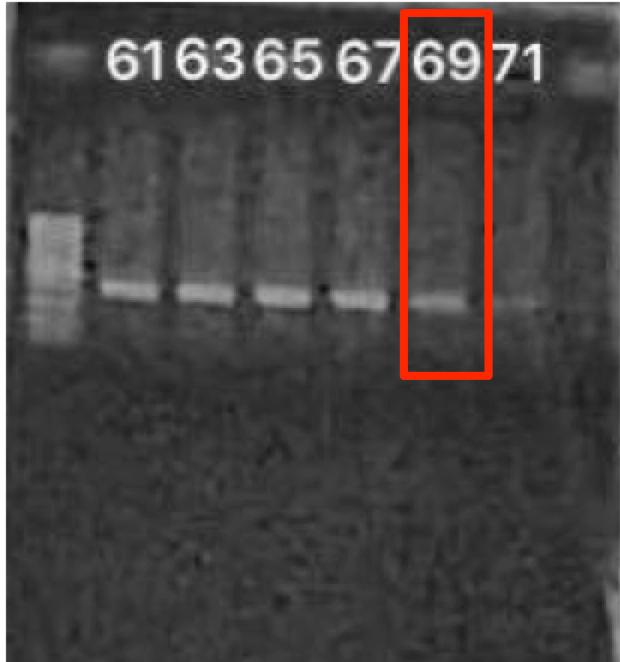
The annealing temperature of the sequencing primers was investigated in order to obtain the best sequencing results. The gradient Ta was tested in the range of 61°C to 71°C to find the optimal Ta temperature for the amplification of PCR product on 1.5% agarose gel. As indicated in Figure 5 , the brightness of the bands decreased from 61°C to 71°C. Therefore, the optimal Ta was selected as 69°C (under the temperature of 71°C).
Confirm 3 control samples by sequencing
Three suspected samples have been sequencing to confirm the genotypes ( Figure 6 ).
Final HRM protocol
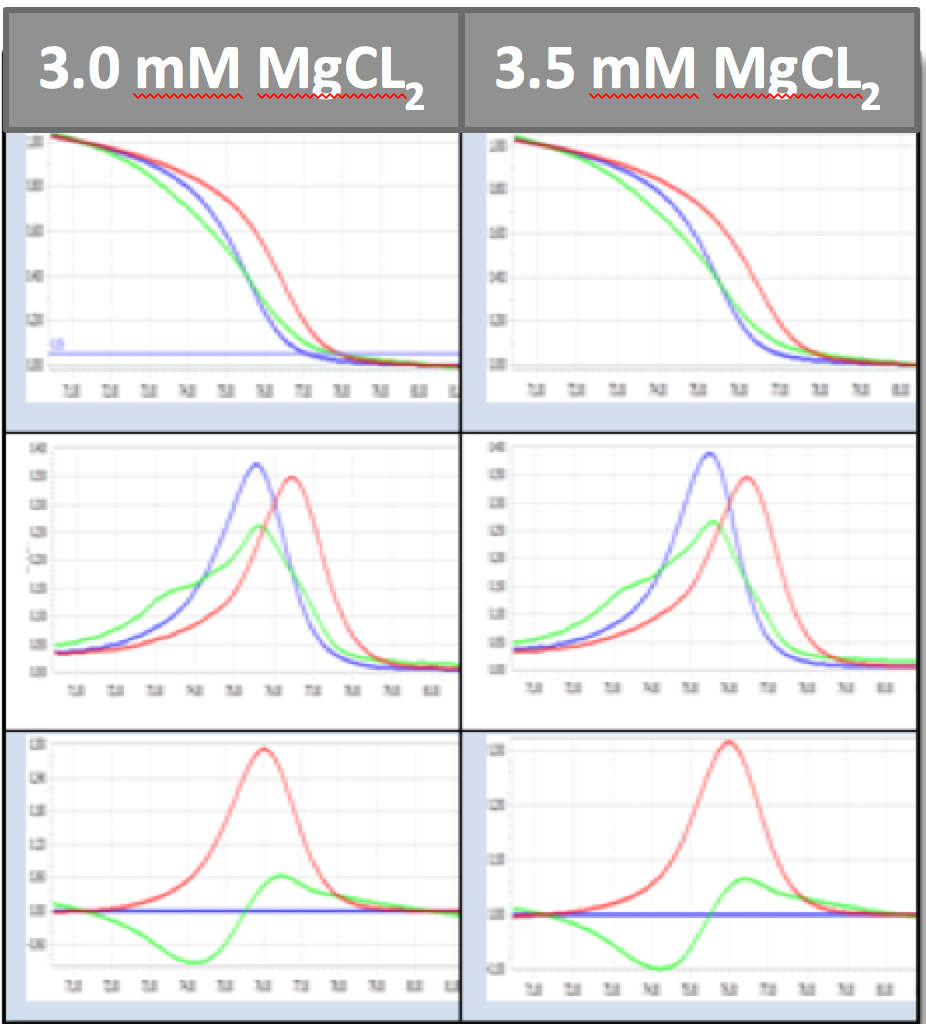
Before genotyping, the 3 positive controls were tested under proper conditions to find out in which MgCl2 concentration allowed the control samples to have the most distinctive curve (g.g. the best melting curve in HRM assay). Optimum MgCl2 concentration would help to reduce non-specific amplification, thus allowing a good discrimination of the 3 control samples. In this study, three positive controls were ran with different MgCl concentrations: 3 mM and 3.5 mM.
It was shown that 3.0 mM and 3.5 mM MgCl2 both give distinctive melting curves and shapes, with the 3 genotype curves separating clearly. Since the 3 amplification curves at 3.0 mM MgCl2 reached a Ct value at 24, while the amplification curve of AA genotype reached Ct value at 28 Figure 7 . The latter may lead to un-stability and, thus, 3.0 mM MgCl2 concentration was considered to the the ideal concentration. Therefore, 3.0mM MgCl2 was selected for the optimized HRM protocol in genotyping rs353291.
Genotyping results
After discovering the optimal HRM conditions, 100 samples from breast cancer patients and 100 controls (without cancer) were evaluated by HRM assay. For each running on HRM, we performed about 16 to 24 reactions (2-3 HRM strips).
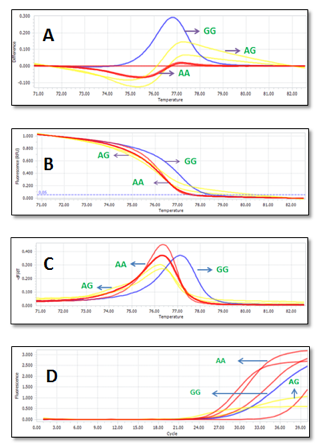
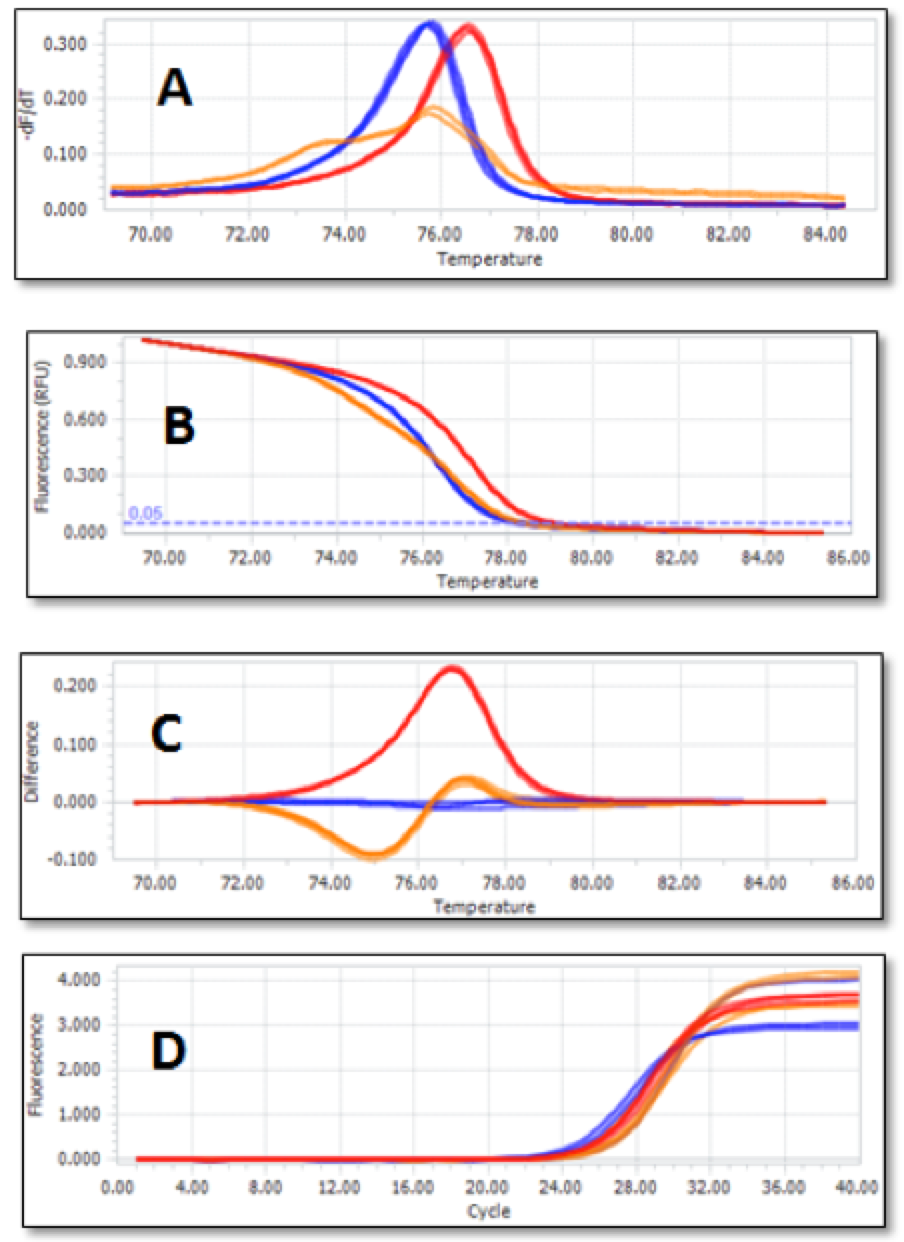
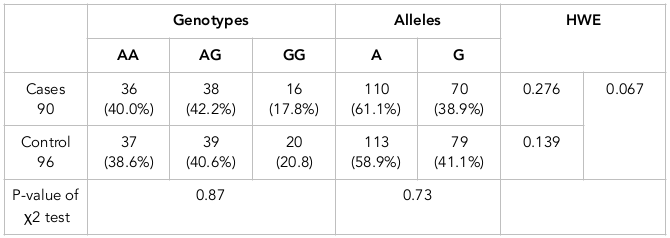
A typical genotyping result is shown in Figure 8 ; the main results are listed in Table 2 and Table 3 . Cases and controls of this SNP are in agreement with the Hardy-Weinberg equilibrium (i.e. HWE) (PHWE>0.05). The agreement of HWE indicates that this sample set can represent the general Vietnamese population. Furthermore, the results of the chi-squared tests indicate that there was no difference between cases and controls for both alleles and genotypes in rs353291 (p>0.05). According to the genotyping results computed in Table 2 , the data of 96 controls showed that A allele comprised 58.9% and G allele accounted for 41.1%. Meanwhile, the frequency of G allele was 38.9% and the frequency of A allele was found to be relatively high with 61.1% in 90 cases. It was noted that the A allele was the major allele of this SNP. Additionally, the higher percentage (19.6%) of allele A in 90 cases, compared with 96 controls, was strong evidence to conclude that allele A is a risk allele in the Vietnamese population. Therefore, Vietnamese people with a higher percentage of A allele in SNP rs353291 may be expected to develop breast cancer.
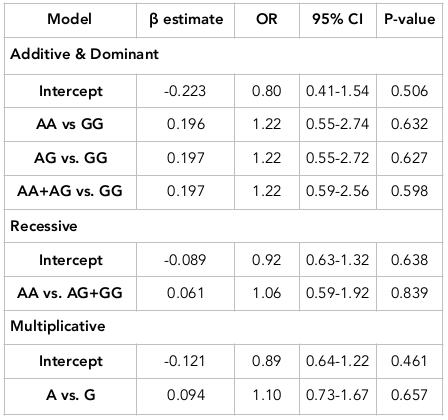
The association between this SNP and breast cancer in the primary sample set was then examined by Rstuio 3.2.2. The results are shown in Table 3 . In allelic model (multiplicative), the A allele can enhance breast cancer risk 1.1 –fold higher compared to G allele (OR [95%CI] =1.10[0.73–1.67]), but it seems not to be significantly associated with the breast cancer risk since p-value is higher than 0.05 (p=0.657). In additive and dominant models, all AA and AG carriers (or the combination of both genotypes in dominant model) can enhance breast cancer risk 1.22-fold greater than GG carriers (OR [95%CI] are 1.22[0.55–2.74], 1.22[0.55-2.72], 1.22[0.59-2.56], respectively). Those alleles tended to increase the breast cancer risk (β>0), although this finding is not significant as p>0.05. The recessive effect of AA genotype compared with reference group (including AG and GG genotypes) have no correlation (OR [95%CI] = 1.06 [0.59–1.92], p=0.839). The logistic analysis showed that SNP rs353291 has no relationship with breast cancer risk (p>0.05).
Evaluation of the HRM method
The success of this method was measured by the stability (Tm change) and sensitivity of 200 samples (100 cases/100 controls samples) on the running HRM without any repeats. The normalized melting curves are shown in Figure 8B . Each genotype grouped together. With HRM, different homozygotes had similar shapes but different Tm. Heterozygotes had a different shape from homozygotes. Similarly, melting peaks also showed distinguishable peaks for each genotype of each SNP ( Figure 8A ). Moreover, in HRM analysis, three genotypes of rs353291 were most easily distinguishable by different plot panels ( Figure 8C ).
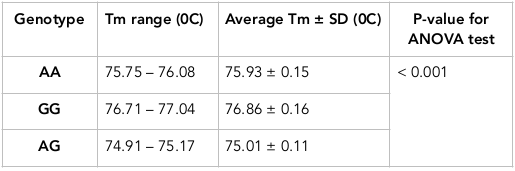
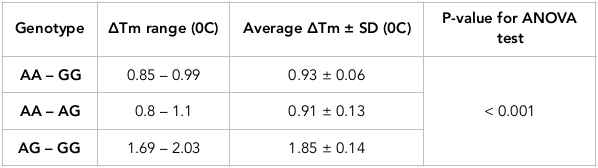
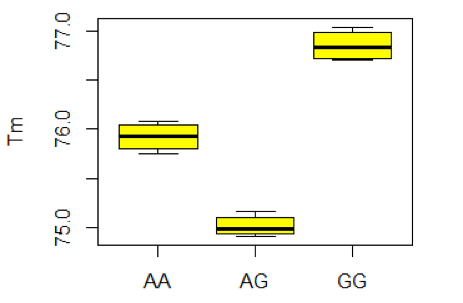
The stability represents Tm change among control samples and different runs, using R statistic software Rstudio 3.2.2. Table 4 shows the average Tm with its standard deviation (SD) for each genotype. The different Tm among samples in each genotype is small. As a result, SD is quite small (0.11 – 0.15) which indicates the small difference of Tm values. In particular, the Tm difference among samples and different runs is not remarkable. According to Table 5 , the average ΔTm between two genotypes is significant difference (P <0.001). However, the variance of ΔTm is not remarkable (from 0.06 to 0.14). High stability is the basis of accurate distinctions of all three genotypes for this SNP. The ANOVA test showed that Tm values among the genotypes could be significantly differentiated by having p-values < 0.001 ( Table 4 ). For rs353291, Tm values of the three genotypes did not overlap each other. The distance between three yellow boxes are large ( Figure 9 ); even the smallest ΔTm value (AA vs. AG) reaches 0.8 which highlights the proper distance needed to have a clear differentiation between three genotypes. In addition, AA peak is different from AG peak. Consequently, the result of three genotypes of this SNP can be read easily by applying HRM method with a large sample amount or many runs.
In most cases, it was possible to directly distinguish the three different genotypes of SNP rs353291 using HRM ( Figure 8 ). Nevertheless, there were some cases where the HRM curves did not cluster around any of the control, or had strange melting patterns ( Figure 10 ). The samples that generated poor results were called failed samples. Finally, the frequencies for each genotype of this SNP were calculated. Overall, for 200 samples, the number of failed samples when genotyping rs353291 was 14 samples. Therefore, we were able to successfully optimize the HRM method with high sensitivity up to 93%.

Discussion
The main purpose of this study was to develop/optimize the High Resolution Melting (HRM) method for genotyping SNP rs353291 in order to estimate the frequency of this SNP, as well as determine the potential association of this SNP and breast cancer in the Vietnamese population. In terms of the genotyping method, the discrimination between two genotypes/amplicons was significantly distinguishable (p-value < 0.001) via ANOVA test ( Table 4 Table 5 ). Furthermore, three genotypes could be discerned by the shape of their melting curves, melting peaks, and/or different plots. The Hardy Weinberg Equilibrium (p-value=0.276; thus >0.05) demonstrated that our population research reached the equilibrium according to Hardy-Weinberg. Thus, this population was able to represent the Vietnamese population. In our study, we successfully genotyped all samples by HRM with high stability and accuracy.
There are so many studies of SNPs on miRNAs which have been conducted recently. It was shown that miRNAs play an essential role in various biological functions including development, cell differentiation, and progression of human diseases Sun et al., 2009. Among them, the mutation on SNP rs353291 (located on miR145 gene) has been reported to be associated with an increased risk of developing breast cancer in two different groups of Australian Caucasians (p-value=0.041 and p=0.023, respectively) Chacon-Cortes et al., 2015. Moreover, it has been used to determine the therapeutic potency of microRNA-145 against breast cancer Kim et al., 2011. Therefore, SNP rs353291 has been assumed to play a role in decreasing the risk of breast cancer by changing the structure and function of miR145. Compared with the research study result in the two Australian populations in which G was the risk allele thought to increase the risk of breast cancer (p = 0.041, p = 0.023, respectively), the result in this study highlighted that SNP rs353291 showed no association with decreased risk of breast cancer in Vietnamese women (p-value >0.05).
Case-control studies of breast cancer among Vietnamese women highlight the potential and success of the HRM method. In this study there is a strong evidence for HRM, a technique that is powerful, simple, fast and effective. An optimal HRMA protocol was applied for genotyping. The study results indicate that A is the major allele with a frequency of 61.1% (38.9% for allele G). Besides, the frequency of major allele A in the Vietnamese population in this study (61.1%) is greater than the frequency of A allele in the control population (58.9%). According to association analysis, A allele may play a role of risk allele when all the models containing A have the potential to increase the risk of breast cancer (OR > 1). However, the confidence interval of all the models seem to be large and the down-index is smaller than 1 (lowest is 0.55). From these calculations, it is assumed that allele A is not entirely account for risk for disease, and may at times even reduce the disease. This ambiguity further proves that allele A may have no effect on the disease. Besides, all the p-values were greater than 0.05; thus, there is no statistical significance. We can conclude, therefore, that SNP rs353291 has no association with risk of breast cancer, based on our study. These results suggest that the Vietnamese population are distinct from other populations concerning this SNP frequency. However, due to the small sample size in this study (90 cases/96 controls), the results were not reliable. Moreover, the power of this study is very low (7%). Thus, we should further study a larger sample size to understand the correlation between this SNP and breast cancer risk in Vietnamese population. In addition, further studies should be conducted on a larger sample size in order to evaluate the correlation between this SNP and breast cancer risk in Vietnamese population. As well, the study needs to be more adequately powered to increase the reliability of the results. According to our calculation, the power of this study could reach 80% if sample size were expanded up to 9,264 cases/controls.
Conclusion
The high resolution melting protocol had been successful in genotyping SNP rs353291 on miR-145. This method is advantageous in that it is quick, simple and effective. Therefore, the optimized HRM protocol could be applied to further association studies of this SNP. The genotyping results showed that the chosen sample sets for genotyping this SNP are suitable for representing the Vietnamese population (PHWE > 0.05).
The association analysis indicates that there was no significant association between SNP rs353291 and breast cancer risk in 96 cases/90 controls. The present study should prompt further larger-scale studies of breast cancer predisposition genes in larger sample sizes. This will help enhance the reliability of the study along with helping to identify the role/function of this SNP before potential use as a biomarker for early breast cancer diagnosis.
Abbreviations
95% CI - 95% confidence interval;
BC - Breast cancer;
HRM - High resolution melt
HWE - Hardy Weinberg equilibrium
miRNA/miR – microRNA
NCBI - National center for biotechnology information
OR - Odd ratio
PCR - Polymerase chain reaction
SD - Standard deviation
SNP - Single nucleotide polymorphism
T-ARMS-PCR - Tetra-primer amplification refractory mutation system PCR
Ta - Annealing temperature
TAPMA - Tetra-Arms-PCR Melting Analysis
Tm - Melting temperature
WHO - World Health Organization
Ethical approval and informed consent
All patients gave informed consent and the studies were approved by the Local Ethics Committee of the Oncology Hospital of Ho Chi Minh City under the decision number 177/HĐĐĐ-CĐT, 18th November 2014.
Author Contribution
HHL contributed to study design, performed the experiment and wrote the manuscript. BTKP performed the experiment. NTNT, NTH reviewed and edited the manuscript for intellectual content. Tran Van Thiep involved in samples collection. Nguyen Thi Hue oriented, gave important idea and revised the manuscript of this review. All authors gave final approval of the version to be published.
References
-
H.C.
Association of Cancer.
Association of Cancer, HCM City.
.
-
G.
Bertoli,
C.
Cava,
I.
Castiglioni.
MicroRNAs: New biomarkers for diagnosis, prognosis, therapy prediction and therapeutic tools for breast cancer. Theranostics.
2015;
5(10)
:
1122-1143
.
View Article Google Scholar -
D.
Chacon-Cortes,
R. A.
Smith,
L. M.
Haupt,
R. A.
Lea,
P. H.
Youl,
L. R.
Griffiths.
Genetic association analysis of miRNA SNPs implicates MIR145 in breast cancer susceptibility. BMC Medical Genetics.
2015;
16(1)
:
107
.
View Article Google Scholar -
Q.-H.
Chen,
Q.-B.
Wang,
B.
Zhang.
Ethnicity modifies the association between functional microRNA polymorphisms and breast cancer risk: A HuGE meta-analysis. Tumour Biology.
2014;
35(1)
:
529-543
.
View Article Google Scholar -
S. Y.
Cui,
R.
Wang,
L. B.
Chen.
MicroRNA‐145: A potent tumour suppressor that regulates multiple cellular pathways. Journal of Cellular and Molecular Medicine.
2014;
18(10)
:
1913-1926
.
View Article Google Scholar -
GLOBOCAN.
GLOBOCAN 2012: Estimated Incidence, Mortality and Prevalence Worldwide in 2012. 2012
.
-
N. T.
Hue,
N. D. H.
Chan,
P. T.
Phong,
N. T. T.
Linh,
N. D.
Giang.
Extraction of human genomic DNA from dried blood spots and hair roots. International Journal of Bioscience.
2012;
Biochemistry
:
Bioinformatics
.
View Article Google Scholar -
M.
Jovanovic,
M.
Hengartner.
miRNAs and apoptosis: RNAs to die for. Oncogene.
2006;
25(46)
:
6176-6187
.
View Article Google Scholar -
S.-J.
Kim,
J.-S.
Oh,
J.-Y.
Shin,
K.-D.
Lee,
K. W.
Sung,
S. J.
Nam,
K.-H.
Chun.
Development of microRNA-145 for therapeutic application in breast cancer. Journal of Controlled Release.
2011;
155(3)
:
427-434
.
View Article Google Scholar -
Y. W.
Kong,
D.
Ferland-McCollough,
T. J.
Jackson,
M.
Bushell.
microRNAs in cancer management. The Lancet. Oncology.
2012;
13(6)
:
e249-e258
.
-
E.
O’Day,
A.
Lal.
MicroRNAs and their target gene networks in breast cancer. Breast Cancer Research.
2010;
12(2)
:
201
.
View Article Google Scholar -
V. Ü.
Onay,
L.
Briollais,
J. A.
Knight,
E.
Shi,
Y.
Wang,
S.
Wells,
H.
Ozcelik.
SNP-SNP interactions in breast cancer susceptibility. BMC Cancer.
2006;
6(1)
:
114
.
View Article Google Scholar -
P.
Qi,
L.
Wang,
B.
Zhou,
W.
Yao,
S.
Xu,
Y.
Zhou,
Z.
Xie.
Associations of miRNA polymorphisms and expression levels with breast cancer risk in the Chinese population. Genetics and Molecular Research.
2015;
14(2)
:
6289-6296
.
View Article Google Scholar -
F.-J.
Song,
K.-X.
Chen.
Single-nucleotide polymorphisms among microRNA: Big effects on cancer. Chinese Journal of Cancer.
2011;
30(6)
:
381-391
.
View Article Google Scholar -
R.
Spizzo,
M.
Nicoloso,
L.
Lupini,
Y.
Lu,
J.
Fogarty,
S.
Rossi,
X.
Liu.
miR-145 participates with TP53 in a death-promoting regulatory loop and targets estrogen receptor-α in human breast cancer cells. Cell Death and Differentiation.
2010;
17(2)
:
246-254
.
View Article Google Scholar -
G.
Sun,
J.
Yan,
K.
Noltner,
J.
Feng,
H.
Li,
D. A.
Sarkis,
J. J.
Rossi.
SNPs in human miRNA genes affect biogenesis and function. RNA (New York, N.Y.).
2009;
15(9)
:
1640-1651
.
-
R.
Takahashi,
H.
Miyazaki,
T.
Ochiya.
The roles of microRNAs in breast cancer. Cancers (Basel).
2015;
7(2)
:
598-616
.
View Article Google Scholar -
P. D. Y.
Trieu,
C.
Mello-Thoms,
P. C.
Brennan.
Female breast cancer in Vietnam: A comparison across Asian specific regions. Cancer Biology & Medicine.
2015;
12
:
238
.
-
E.
Schooneveld,
H.
Wildiers,
I.
Vergote,
P. B.
Vermeulen,
L. Y.
Dirix,
S. J.
Van Laere.
Dysregulation of microRNAs in breast cancer and their potential role as prognostic and predictive biomarkers in patient management. Breast Cancer Research.
2015;
17(1)
:
21
.
View Article Google Scholar -
D. A.
Vuong,
M.
Velasco-Garrido,
T. D.
Lai,
R.
Busse.
Temporal trends of cancer incidence in Vietnam, 1993-2007. Asian Pacific Journal of Cancer Prevention.
2010;
11
:
739-745
.
-
S.
Wang,
C.
Bian,
Z.
Yang,
Y.
Bo,
J.
Li,
L.
Zeng,
R. C.
Zhao.
miR-145 inhibits breast cancer cell growth through RTKN. International Journal of Oncology.
2009;
34
:
1461
.
-
J.
Zhang,
Q.
Sun,
Z.
Zhang,
S.
Ge,
Z.
Han,
W.
Chen.
Loss of microRNA-143/145 disturbs cellular growth and apoptosis of human epithelial cancers by impairing the MDM2-p53 feedback loop. Oncogene.
2013;
32(1)
:
61-69
.
View Article Google Scholar
Comments

Downloads
Article Details
Volume & Issue : Vol 4 No 12 (2017)
Page No.: 1812-1831
Published on: 2017-12-08
Citations
Copyrights & License
This work is licensed under a Creative Commons Attribution 4.0 International License.
Search Panel
Pubmed
Google Scholar
Pubmed
Google Scholar
Pubmed
Google Scholar
Pubmed
Search for this article in:
Google Scholar
Researchgate
- HTML viewed - 9585 times
- Download PDF downloaded - 2353 times
- View Article downloaded - 0 times
