

Separation of Veins and Arteries for estimating Hypertensive Retinopathy in Fundus Images
Copyrights: Shafiq Hussain, Muhammad Rehan Faheem, 2016. License: This work is licensed under a Creative Commons Attribution 4.0 International License.
Abstract
The determinations of Hypertensive Retinopathy (HR) through retinal pictures turn out being a vital issue today since HR is quickly expanding ailment that is found in eyes. HR happens because of the height of the circulatory strain. The most imperative estimation that is used to analyze HR through retinal pictures is arteriovenous proportion (AVR). This paper depicts a strategy to decide AVR by first section the vessels using match separating method and afterward identify the optic circle to decide the Region of Interest. When the area of interest is discovered, we order the veins into supply routes and veins utilizing Neural Network to decide the AVR. Once the vessels are classified, we separate the arteries and veins based on the color separation. The work is performed by using MATLAB R2014. This paper is partitioned into four segments. Area one portrays the introduction. Area two decribes the technique/ systems to decide AVR. Area three depicts the examination of results with some past results. Segment four portrays the conclusion.
Introduction
Hypertension is the infection that spreads in the human body in different structures. It happens because of the high blood weight and makes harm the retina of the eye. The harm of retina because of hypertension is known as hypertensive retinopathy. Retina is the part of the eye which changes the light into nerve signal that finally received by the cerebrum. The harm of retina will lead towards the loss of vision or even visual deficiency. Therefore, in order to conquer this issue, numerous mechanized framework have been presented which helps the ophthalmologist in analyzing the eye patients. The writing audit of past work is depicted underneath.
Ruggeri et al., 2007 proposed a method which decides the hypertensive retinopathy by the estimation of arteriolar-to-venular (AVR) proportion. To do this, they proposed procedure which first takes the fundus picture as information, and after that applies the following calculation of vessels. As the vessels are followed, then it orders the vessels as supply routes or veins by using shading highlight inside the district of the hobby. Once the framework groups the vessels, the following step is to decide the AVR. With the assistance of AVR, the framework tells whether hypertensive retinopathy is found or not.
Manikis et al., 2011 added to a Graphical User Interface framework for diagnosing HR at ahead of schedule stages. The created framework gives the office of selecting any point for measuring vessels distance across. The created framework likewise gives the office of altering the representation of vessels. So therefore, the person who is utilizing the framework is protected from different potential outcomes of division misclassifications. It’s created framework fragment the veins by multiscale separating. The framework then measures the width of vessels in the area of the hobby. Subsequent to measuring the width of the vessels, the framework ascertained the AVR so as to analyze HR. The proposed framework tried on the two openly accessible databases DRIVE and STARE.
Chaudhuri et al., 1989 portray the strategy/procedure to extricate the elements. Their proposed system extricates the components from the retinal pictures on the base of spatial and optical properties of the vessels in the retinal picture. Their proposed strategy uses the edge administrator to improve the vessels. So that it’s anything but difficult to identify the vessels in the retinal pictures. At that point at the last, their proposed method uses the coordinated channel strategy to distinguish the vessels.
Zhang et al., 2010 use the match channel system along the Gaussian subsidiary to extricate the veins. The extraction of veins is the imperative assignment with a specific end goal to analyze the infection through retinal/fundus pictures. Their proposed framework takes the retinal picture as an info, and afterward upgrades the veins by applying the Gaussian subordinate. At that point, it applies the match sifting procedure to identify the veins, with the goal that it could be anything but its difficult to locate the coveted illness.
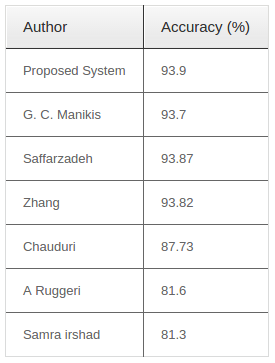
Mohammadi Saffarzadeh et al., 2014use the two strategies to fragment the veins. Vahid Mohammadi Saffarzadeh utilizes the K-implies grouping and multi-scale line procedure to the portion the veins. Division of veins is the essential assignment in diagnosing the illness through retinal pictures. By sectioning the veins the precision of distinguishing/diagnosing illness turns out to be better. A framework was purposed by Vahid Mohammadi Saffarzadeh in which he utilized the Kmean clustering to obtain brilliant results. When the splendid injuries are diminished, it fragments the veins by utilizing the multi-scale line system. This is done by the use of the Drive database to test the framework. The exactness of their framework is 0.938.
Irshad and Akram, 2014 discover the Cotton Wool Spot (CWS) which is the indication of distinguishing hypertensive retinopathy (HR). Their created system decides the CWS locales by applying the worldwide limit on the improved vessels. The created framework tried on local retinal pictures dataset, which gives the exactness of 81.3%.
Methods
The accompanying Figure 1 demonstrates the progressions of proposed strategy/procedure. The framework first takes the retinal picture as information. Then we performed the preprocessing step to expel the clamor from the picture. At that point section the veins utilizing match separating procedure and characterized the vessels as veins and arteries utilizing neural system. At long last, we did the step to discover the district of hobby by separately determination of the width of arteries and veins. This approach gives the better accuracy as compared to previous results.
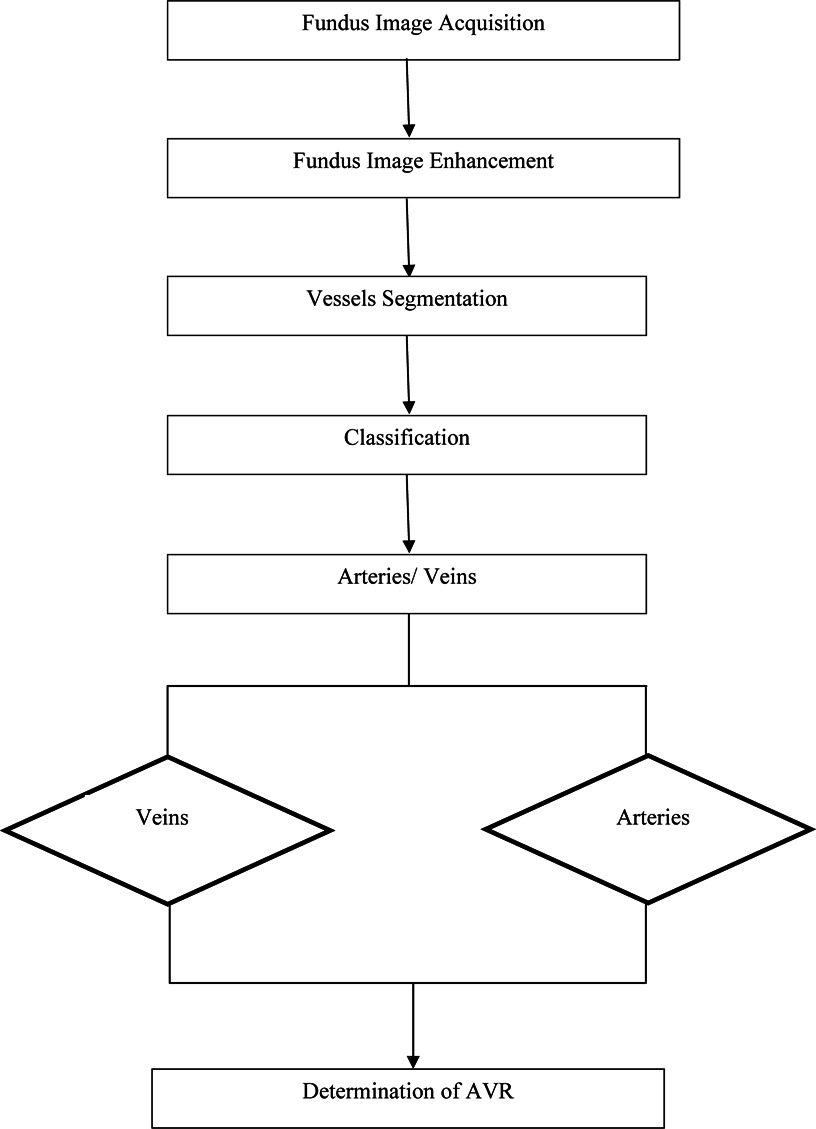
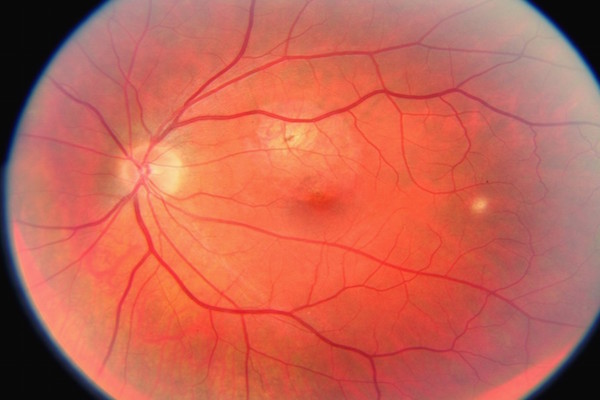
Image Acquisition
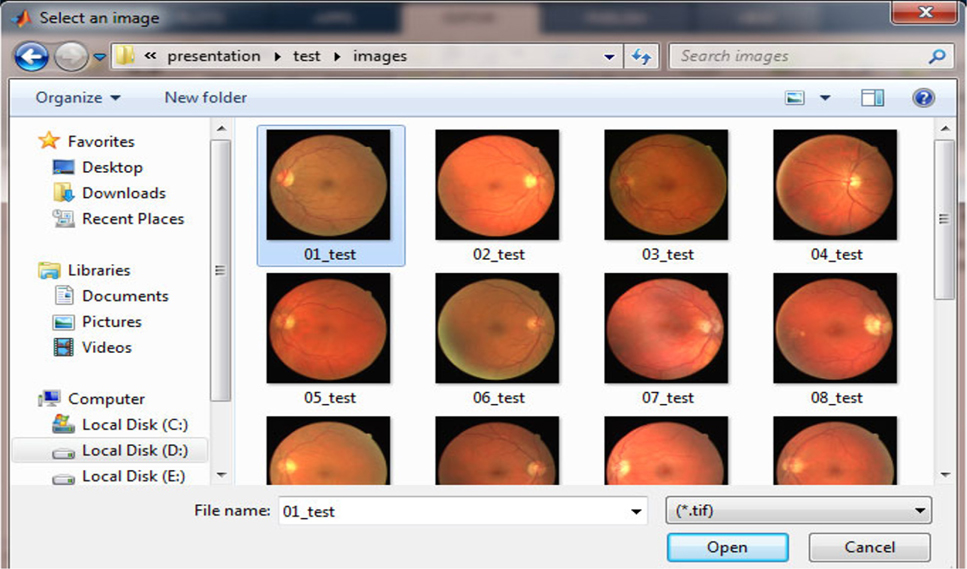
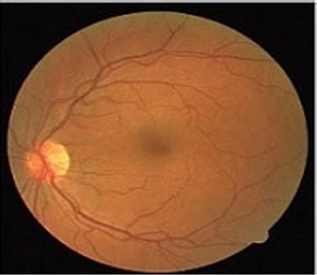
The first step is to take the image of vessels as an input. The developed system takes the image as an input from the Drive database which is publicdatabase. The Figure 2 shows how the system loads the image from the drive database by using uigetfile command. When the system finishes loading the image, it uses the imread command to read the image as shown in the Figure 3 .
Retinal Image Preprocessing
In preprocessing step, information retinal picture is changed over into the dark level picture. Then we upgraded the dark level picture by using morphological top-cap change. As a consequence of upgradation, the clamor and pointless pixels from foundation will evacuate which makes the framework to effectively fragment the vessels and discover the locale of hobby.
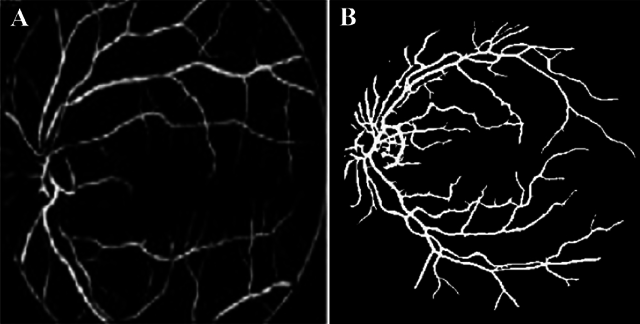
After the vessels are upgraded, the following step is to segment the vessels. There are numerous procedures/methods available for vessels division. The vessels can be segmented by utilizing shrewd administrator, Sobel operator, perwitt operator (it is the operator used for image segmentation) and match separating (Basavaprasad B) etc. The proposed strategy portions the vessels using match separating procedure. The proposed method/strategy utilizes the thresholding as a part of the request to get the high exactness of fragmented vessels (M. U.Akram, 2013). The Figure 4 demonstrates the preprocessing and division of veins.
Classification of Vessels
There are regulated and unsupervised methods accessible for vessels characterization. All the managed strategies/methods performed the grouping in light of the pixels. The best regulated systems are neural system and support vector machines (SVM). The proposed philosophy uses the neural system for grouping of vessels which is the regulated procedure. The received strategy first prepares the arrangement of available pictures from drive database. After that we test the pictures to characterize/decide vessels as conduits or veins. Neural system classifier uses the component vector taking into account Hu minute invariants and neighborhood dark level data to get the pixel of preparing pictures (Sinthanayothin, J.V.B Soares, Lapascu). At that point, it tests the pixel-bypixel characterization of vessels to decide which one are conduits or which one are veins. The Figure 5 shows the result of vessels classification.
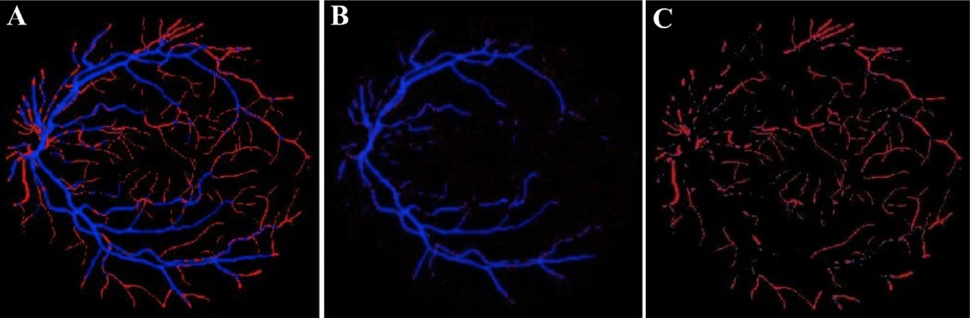
Estimation of Blood Vessels Width
Once the supply routes and veins are isolated inside of the area of hobby, the following step is to gauge the width of supply routes and veins. To measure the width, a matter of first importance is to take the supplement of isolated courses what’s more, veins. The proposed system separates the arteries and veins by using the color based segmentation. It’s quite easy to determine the width of veins and arteries with better accuracy by seperating the arteries and veins. By taking the supplement it changes over the 0 pixel into1 and 1 pixel into 0. At that point,two-dimensional Euclidean distance is used to get the separation map for both arteries and veins (B. Heinz). In the wake of getting the separation, the following step is to decide the middle line of both supply routes and veins by utilizing morphological diminishing operation. The final step is to increase 2 with yield of past stride in order to get the genuine width of veins and courses.
Figuring and Grading of AVR
Once the vessels width is measured, the following step is to decide AVR. The AVR is found by using Parr-Hubbar recipes (Spears). There are two equations concurring to Parr-Hubbar which are as per the following: One is the Central Retinal Artery Equivalent that is utilized to figure the width of veins. Another one is the Central Retinal Vein equal that is utilized to ascertain the width of veins.
As the result of deciding the CRAE and CRVE, AVR is effectively figured by partitioning CRAE by CRVE which is appeared as underneath:
A V R = C R A E C R V E
Following of deciding AVR, the last step is to decide the evaluation/phase of Hypertensive retinopathy. Keith Wagener Barker gives the 4 grades for different phases of HR alongside their side effects.
Results
The following Table 1 shows the result of comparison with few other authors work.
Conclusion
This proposed strategy/method gives the help of diagnosing hypertensive retinopathy naturally. Our proposed approach acknowledges the retinal picture and figures out if hypertensive retinopathy is found or not by estimation of AVR. The proposed philosophy/method includes of five stages i.e. preprocessing, division of vessels, arrangement of vessels, region of interest and in the end presence of HR is determined. Nonetheless, correlation of our result with some past results demonstrates that utilizing neural system results are tiny bit better.
References
-
S.
Chaudhuri,
S.
Chatterjee,
N.
Katz,
M.
Nelson,
M.
Goldbaum.
Detection of blood vessels in retinal images using two-dimensional matched filters. IEEE Transactions on Medical Imaging.
1989;
8
:
263-269
.
-
S.
Irshad,
M.U.
Akram.
Classification of retinal vessels into arteries and veins for detection of hypertensive retinopathy. In 2014 Cairo International Biomedical Engineering Conference (CIBEC) (Institute of Electrical & Electronics Engineers (IEEE)).
2014
.
-
G.C.
Manikis,
V.
Sakkalis,
X.
Zabulis,
P.
Karamaounas,
A.
Triantafyllou,
S.
Douma,
C.
Zamboulis,
K.
Marias.
An image analysis framework for the early assessment of hypertensive retinopathy signs. Paper presented at: E-Health and Bioengineering Conference (EHB) 2011 (IEEE).
2011
.
-
V.
Mohammadi Saffarzadeh,
A.
Osareh,
B.
Shadgar.
Vessel segmentation in retinal images using multi-scale line operator and K-means clustering. Journal of medical signals and sensors.
2014;
4
:
122-129
.
-
A.
Ruggeri,
E.
Grisan,
M.
De Luca.
An automatic system for the estimation of generalized arteriolar narrowing in retinal images. In 2007 29th Annual International Conference of the IEEE Engineering in Medicine and Biology Society (Institute of Electrical & Electronics Engineers (IEEE)).
2007
.
-
B.
Zhang,
L.
Zhang,
L.
Zhang,
F.
Karray.
Retinal vessel extraction by matched filter with first-order derivative of Gaussian. Computers in Biology and Medicine.
2010;
40
:
438-445
.
Comments
Downloads
Article Details
Volume & Issue : Vol 3 No 06 (2016)
Page No.: 673-678
Published on: 2016-06-26
Citations
Copyrights & License
This work is licensed under a Creative Commons Attribution 4.0 International License.
Search Panel
- HTML viewed - 5730 times
- Download PDF downloaded - 1838 times
- View Article downloaded - 10 times
