


Evaluation of MECP2 and IL-6 Expression in Peripheral Blood of Young Vietnamese Patients with Depression

- University of Health Sciences, Vietnam National University Ho Chi Minh City, Ho Chi Minh City, Vietnam
- Vietnam National University Ho Chi Minh City, Ho Chi Minh City, Vietnam
- Center for Genetics and Reproductive Health, Ho Chi Minh City, Vietnam
- Tam Anh General Hospital, Ho Chi Minh City, Vietnam
- Children’s Hospital 2, Ho Chi Minh City, Vietnam
- Psychiatric Hospital of Ho Chi Minh City, Ho Chi Minh City, Vietnam
Abstract
Background: Interleukin-6 (IL-6) is a pivotal pro-inflammatory cytokine linked to the pathophysiology of major depressive disorder (MDD). Methyl-CpG binding protein 2 (MECP2) is an essential epigenetic reader that regulates chromatin architecture and DNA methylation-dependent transcriptional repression, thereby modulating diverse target genes, including IL-6. This study aimed to evaluate peripheral blood mRNA expression levels of MECP2 and IL-6, characterize their correlation, and assess their association with clinical depressive symptom dimensions in a young Vietnamese cohort.
Methods: Peripheral venous blood samples were obtained from 34 young patients diagnosed with depressive disorders (stratified into mild-to-moderate depression [mildD, Patient Health Questionnaire-9 (PHQ-9) score 5–14, N = 19] and severe depression [SD, PHQ-9 score ≥15, N = 15]) and 18 age-matched healthy controls (PHQ-9 <4; N = 18 for MECP2, N = 8 for IL-6). Transcript abundance was quantified using reverse transcription quantitative real-time PCR (RT-qPCR) with specific TaqMan probes normalized to small nuclear RNA U6 (snU6). Non-parametric analyses included the Kruskal-Wallis H-test, Spearman's rank correlation (ρ), Kendall's tau (τ), distance correlation (dCor), and Generalized Additive Models (GAM).
Results: Both MECP2 and IL-6 expression exhibited significant stage-dependent variations. In patients with mild-to-moderate depression, MECP2 and IL-6 expressions were significantly upregulated compared with healthy controls (MECP2: 1.454-fold, p = 0.0082; IL-6: 10.196-fold, p = 0.0035). Conversely, in patients with severe depression, expression levels did not differ significantly from controls (MECP2: 1.22-fold, p = 0.4696; IL-6: 1.58-fold, p = 0.2453), with IL-6 expression being 6.67-fold lower in severe cases compared with mild-to-moderate cases (p = 0.0019). GAM and correlation analyses revealed a significant moderate positive correlation between MECP2 and IL-6 expression (ρ = 0.4887, p = 0.0034; dCor = 0.4891). Furthermore, peripheral ΔCtIL-6 values correlated significantly with specific PHQ-9 symptom domains, including anhedonia (Q1, ρ = 0.470, p = 0.007), depressed mood (Q2, ρ = 0.429, p = 0.010), and sleep disturbance (Q3, ρ = 0.517, p = 0.002).
Conclusions: Peripheral MECP2 and IL-6 expression levels demonstrate dynamic, severity-dependent regulation, being prominently elevated during early and mild-to-moderate depression but normalized in severe states. The selective correlation between IL-6 expression and core depressive symptom clusters supports its potential utility as a state-dependent molecular indicator of neuroimmune dysregulation in youth depression.
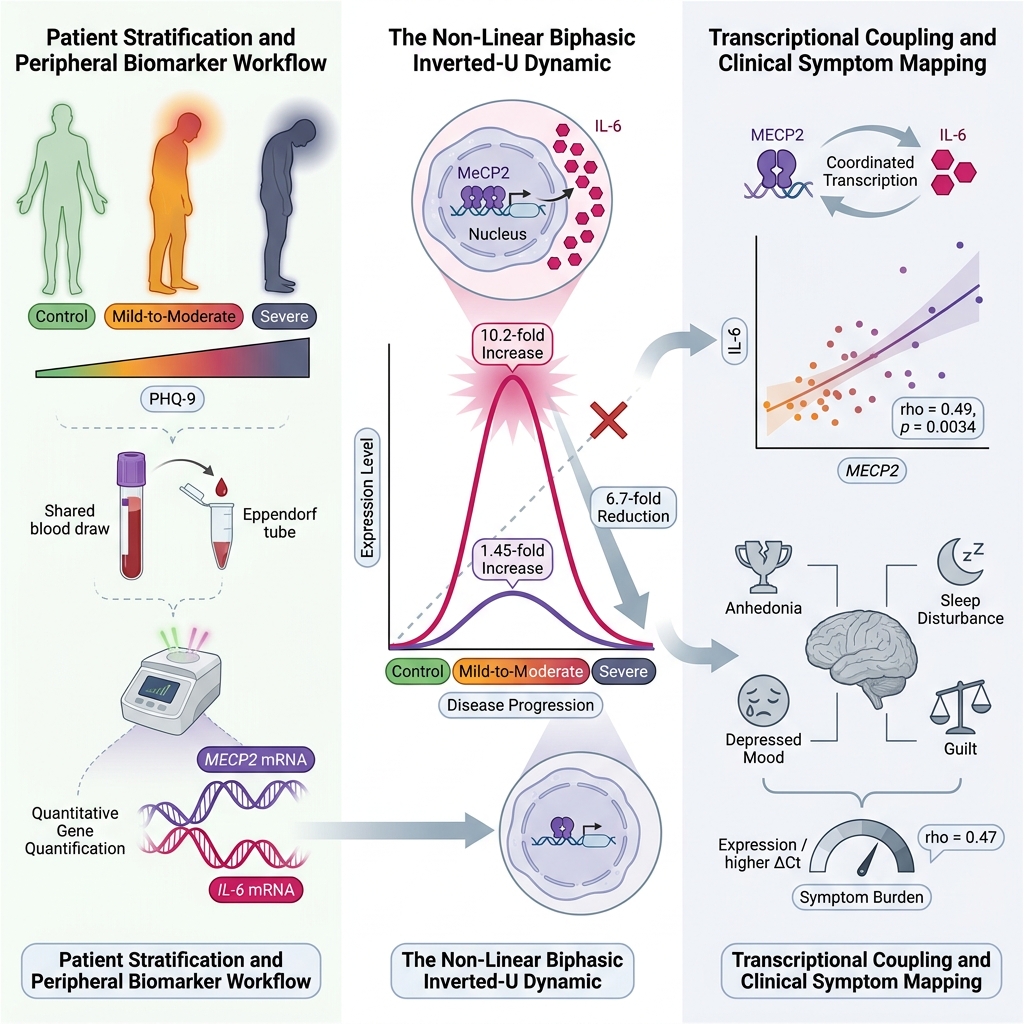
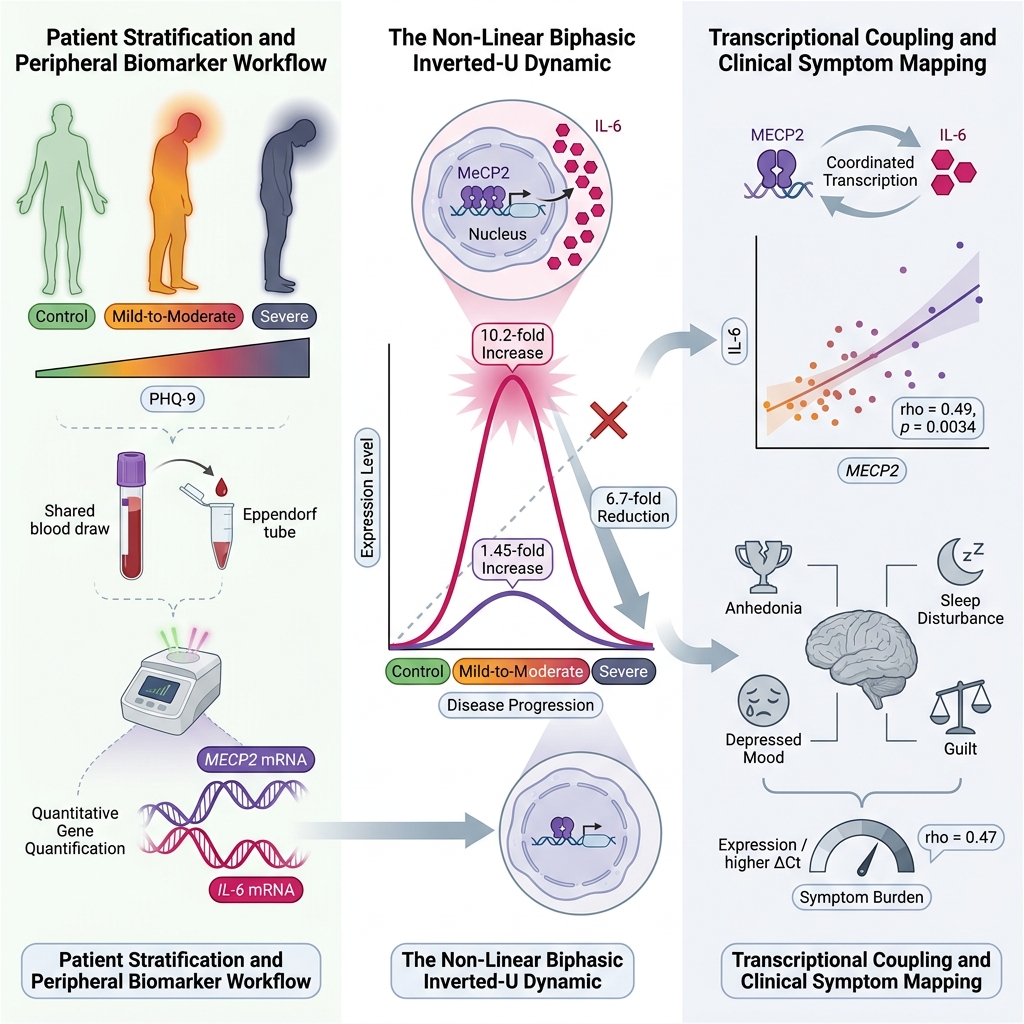
Graphical abstract
Introduction
Pathophysiology and Clinical Diagnostics of Depression
Depression, specifically major depressive disorder (MDD), is a debilitating and prevalent psychiatric disorder characterized by persistent low mood, pervasive anhedonia, cognitive impairment, fatigue, and neurovegetative disturbances in sleep and appetite1. The etiology of MDD is multifactorial, involving complex, bidirectional interactions among neurochemical, neuroendocrine, and neuroimmune pathways2. Although classical monoaminergic models attribute depressive pathogenesis to functional deficits in serotonin (5-hydroxytryptamine, 5-HT), norepinephrine (NE), and dopamine (DA) neurotransmission3,4, monoaminergic dysregulation alone fails to fully account for the delayed therapeutic onset of antidepressants and the high rates of treatment resistance.
Compelling clinical and preclinical evidence indicates that chronic systemic and neuroinflammation serves as a central driver in the onset and maintenance of depressive pathology. Individuals with MDD consistently exhibit elevated systemic levels of pro-inflammatory cytokines, including interleukin-6 (IL-6), interleukin-1 beta (IL-1β), and tumor necrosis factor-alpha (TNF-α)5,6,7,8. Pro-inflammatory signaling disrupts blood-brain barrier permeability, activates microglial cells, and dysregulates the hypothalamic-pituitary-adrenal (HPA) axis via sustained glucocorticoid exposure and glucocorticoid receptor insensitivity2,8. Despite substantial progress in identifying candidate neuroimmune mediators, objective, laboratory-based molecular diagnostic tools remain unavailable in routine psychiatric practice. Clinical evaluations continue to depend almost exclusively on subjective psychometric questionnaires, such as the 9-item Patient Health Questionnaire (PHQ-9), which introduces diagnostic variability and complicates treatment stratification.
Epigenetic Regulation by MECP2 and the Role of IL-6 in Neuroimmune Stress Responses
Epigenetic mechanisms, such as DNA methylation and histone modifications, mediate long-lasting alterations in gene expression in response to environmental stressors and early-life trauma. Methyl-CpG binding protein 2 (MECP2) is an essential epigenetic reader encoded on the X chromosome that binds to 5-methylcytosine (5mC) and 5-hydroxymethylcytosine (5hmC) residues in promoter and enhancer regions, orchestrating chromatin remodeling and transcriptional repression. Although originally characterized in the context of neurodevelopmental conditions such as Rett syndrome, MECP2 plays indispensable roles in adult synaptic plasticity, stress reactivity, and immunomodulation9,12,13.
At the molecular level, MECP2 directly interacts with the promoter of the IL-6 gene to suppress its transcription, thereby preventing aberrant hyperactivation of the IL-6/signal transducer and activator of transcription 3 (STAT3) inflammatory cascade9. Clinically, elevated IL-6 levels have been consistently reported in patients with depressive disorders and are thought to participate causally in mood regulation10,11. However, the precise regulatory interplay between MECP2 expression and IL-6 transcription in peripheral blood—and how their expression dynamics fluctuate with depressive disease severity—remains poorly defined in young cohorts. To bridge this knowledge gap, the present study quantified peripheral blood mRNA expression levels of MECP2 and IL-6, evaluated their correlation using nonlinear and rank-based statistical models, and examined their relationship with PHQ-9 clinical symptom dimensions in young Vietnamese individuals with depression.
Materials and Methods
Study Cohorts and Ethical Approval
A total of 34 young patients diagnosed with depressive disorders were recruited between October 2023 and October 2024. Initial screening was performed using the Vietnamese version of the PHQ-9 instrument, followed by comprehensive clinical evaluations and formal psychiatric diagnoses established by licensed psychiatrists at the Psychiatric Hospital of Ho Chi Minh City in accordance with the Diagnostic and Statistical Manual of Mental Disorders (DSM-5) criteria. Depressed participants were stratified into two clinical severity subgroups: mild-to-moderate depression (mildD group; PHQ-9 score 5–14; N = 19) and severe depression (SD group; PHQ-9 score ≥15; N = 15). All participants in the depression cohort were either antidepressant-naïve or had discontinued psychotropic medications for at least three months prior to blood collection.
An age-matched healthy control cohort consisting of 18 individuals (PHQ-9 score <4, absence of psychiatric or neurological disorders, no current medication use, and no underlying chronic medical conditions) was recruited concurrently. Due to sample volume and laboratory processing constraints, all 18 control samples were evaluated for MECP2 expression, while 8 evaluable control samples were available for IL-6 expression analysis. The study protocol was approved by the Institutional Review Board (IRB) under Decision Number 07/QĐ-IRB-VN01.017. All participants (and legal guardians for adolescent subjects under 18 years of age) provided written informed consent prior to study enrollment.
Total RNA Extraction and Quality Assessment
Venous blood samples (2.0 mL) were collected into EDTA-K2 anticoagulant tubes and processed within 2 h at room temperature (or within 24 h when maintained at 4–8°C). Whole blood was centrifuged at 3,000 rpm (approximately 1,000 × g) for 15 min at room temperature to fractionate blood components. Following plasma separation, the buffy coat layer (~100 μL) enriched with peripheral blood mononuclear cells (PBMCs) and leukocytes was isolated. Total RNA was extracted using the GeneJET RNA Purification Kit (Thermo Fisher Scientific, Waltham, MA, USA) under certified RNase-free conditions according to the manufacturer's protocol. Total RNA was eluted in 40 μL of sterile nuclease-free water, quantified by spectrophotometry (Eppendorf BioSpectrometer® Basic, Eppendorf, Hamburg, Germany), and stored at -30°C. Optical density ratios (A260/A280 and A260/A230) were recorded to assess RNA purity.
Reverse Transcription and cDNA Synthesis
First-strand complementary DNA (cDNA) was synthesized from 10 μL of purified total RNA using the High-Capacity cDNA Reverse Transcription Kit (Thermo Fisher Scientific) in a total reaction volume of 20 μL. Reverse transcription was carried out on a thermal cycler under the following conditions: 25°C for 10 min (primer annealing), 37°C for 120 min (cDNA synthesis), and 85°C for 5 min (enzyme inactivation), followed by rapid cooling to 4°C. Synthesized cDNA was either utilized immediately for qPCR amplification or stored in aliquots at -30°C.
Quantitative Real-Time PCR (qPCR)
Quantitative real-time PCR reactions were performed in duplicate on the Applied Biosystems™ 7500 Real-Time PCR System (Thermo Fisher Scientific). Each 10.0 μL reaction mixture contained 2.0 μL of cDNA template and 8.0 μL of reaction master mix consisting of TaqMan™ Universal Master Mix II (no UNG, Thermo Fisher Scientific) and specific TaqMan™ Gene Expression Assays: MECP2 (Assay ID: Hs05049079_g1), IL-6 (Assay ID: Hs00174131_m1), and small nuclear RNA U6 (snU6, Assay ID: 001973) as the endogenous reference gene. The amplification conditions were: initial denaturation at 95°C for 10 min, followed by 40 cycles of 95°C for 15 s and 60°C for 60 s. Baseline thresholds were set uniformly at 0.01 to ensure standardized cycle threshold (Ct) determination.
Standard Curve Construction and Amplification Efficiency
To validate assay robustness, standard curves were generated using serially diluted total RNA (two-fold serial dilutions across five concentration levels in duplicate) extracted from healthy human peripheral blood. The standard curves demonstrated excellent linearity and amplification efficiency across all targets: MECP2 (efficiency = 98.0%, R = 0.991), IL-6 (efficiency = 95.3%, R = 0.909), and snU6 (efficiency = 98.6%, R = 0.991). Relative gene expression was calculated using the comparative Livak 2 method, where ΔCt = Ct - Ct and ΔΔCt = ΔCt - ΔCt.
Statistical and Data Analysis
Data distributions were evaluated for normality. Because variables demonstrated non-normal distributions, non-parametric tests were employed. Differences in relative expression levels between groups were assessed using the Kruskal-Wallis H-test. Bivariate associations were examined using Spearman’s rank correlation coefficient (ρ), Kendall’s rank correlation coefficient (τ), and distance correlation (dCor) with 1,000 bootstrap permutations to capture nonlinear associations. To model the potentially complex nonlinear relationships between MECP2 and IL-6, Generalized Additive Models (GAM) with penalized thin plate regression splines (s) were fitted. Statistical analyses and visualization were performed in R software (v4.3.0, R Foundation for Statistical Computing, Vienna, Austria). A two-tailed p-value < 0.05 was considered statistically significant.
Results
Demographic and Clinical Profile of the Study Cohort
A total of 34 young Vietnamese individuals with depression and 18 healthy controls were evaluated. Participants in the depression cohort had a mean age of 19.85 ± 2.41 years (range: 14–24 years), and the control group had a mean age of 19.61 ± 2.52 years, confirming comparable age and developmental baseline across cohorts. Based on clinical evaluation and PHQ-9 stratification, 19 patients were categorized into the mild-to-moderate depression group (mildD; PHQ-9: 5–14; including 5 inpatients and 14 outpatients/community cases) and 15 patients were categorized into the severe depression group (SD; PHQ-9 ≥15; all requiring hospitalization).
Total RNA yields ranged from 5.0 to 20.0 ng/μL, with an A260/A280 purity ratio of 1.80–2.43. The summary statistics of normalized ΔCt values for MECP2 and IL-6 in the depression cohort are detailed in Table 1. Individual demographic characteristics, PHQ-9 scores, and raw ΔCt values are compiled in Appendix 1.
Statistical Analysis of Normalized ΔCt Values for
| Statistical Metric | ΔCt | ΔCt |
|---|---|---|
| Sample Size (N) | 34 | 34 |
| Mean | 4.5021 | 11.7477 |
| Standard Deviation (SD) | 0.8808 | 2.4346 |
| Variance | 0.7529 | 5.7531 |
| Geometric Mean | 4.4205 | 11.4858 |
| Median | 4.4950 | 12.2800 |
| 95% Confidence Interval (CI) | [4.1950, 4.8090] | [10.8980, 12.5970] |
Alterations in MECP2 Expression Across Depression Subgroups
Peripheral blood MECP2 mRNA expression was significantly higher in individuals with depressive disorders than in healthy controls (1.347-fold increase, Kruskal-Wallis H = 4.2357, df = 1, p = 0.0396; N = 52, comprising 34 patients and 18 controls; Figure 1A, 1B). Subgroup analysis revealed that this upregulation was driven primarily by patients with mild-to-moderate depression (mildD group), who exhibited a 1.454-fold elevation in MECP2 expression relative to controls (H = 6.9889, df = 1, p = 0.0082; N = 37).
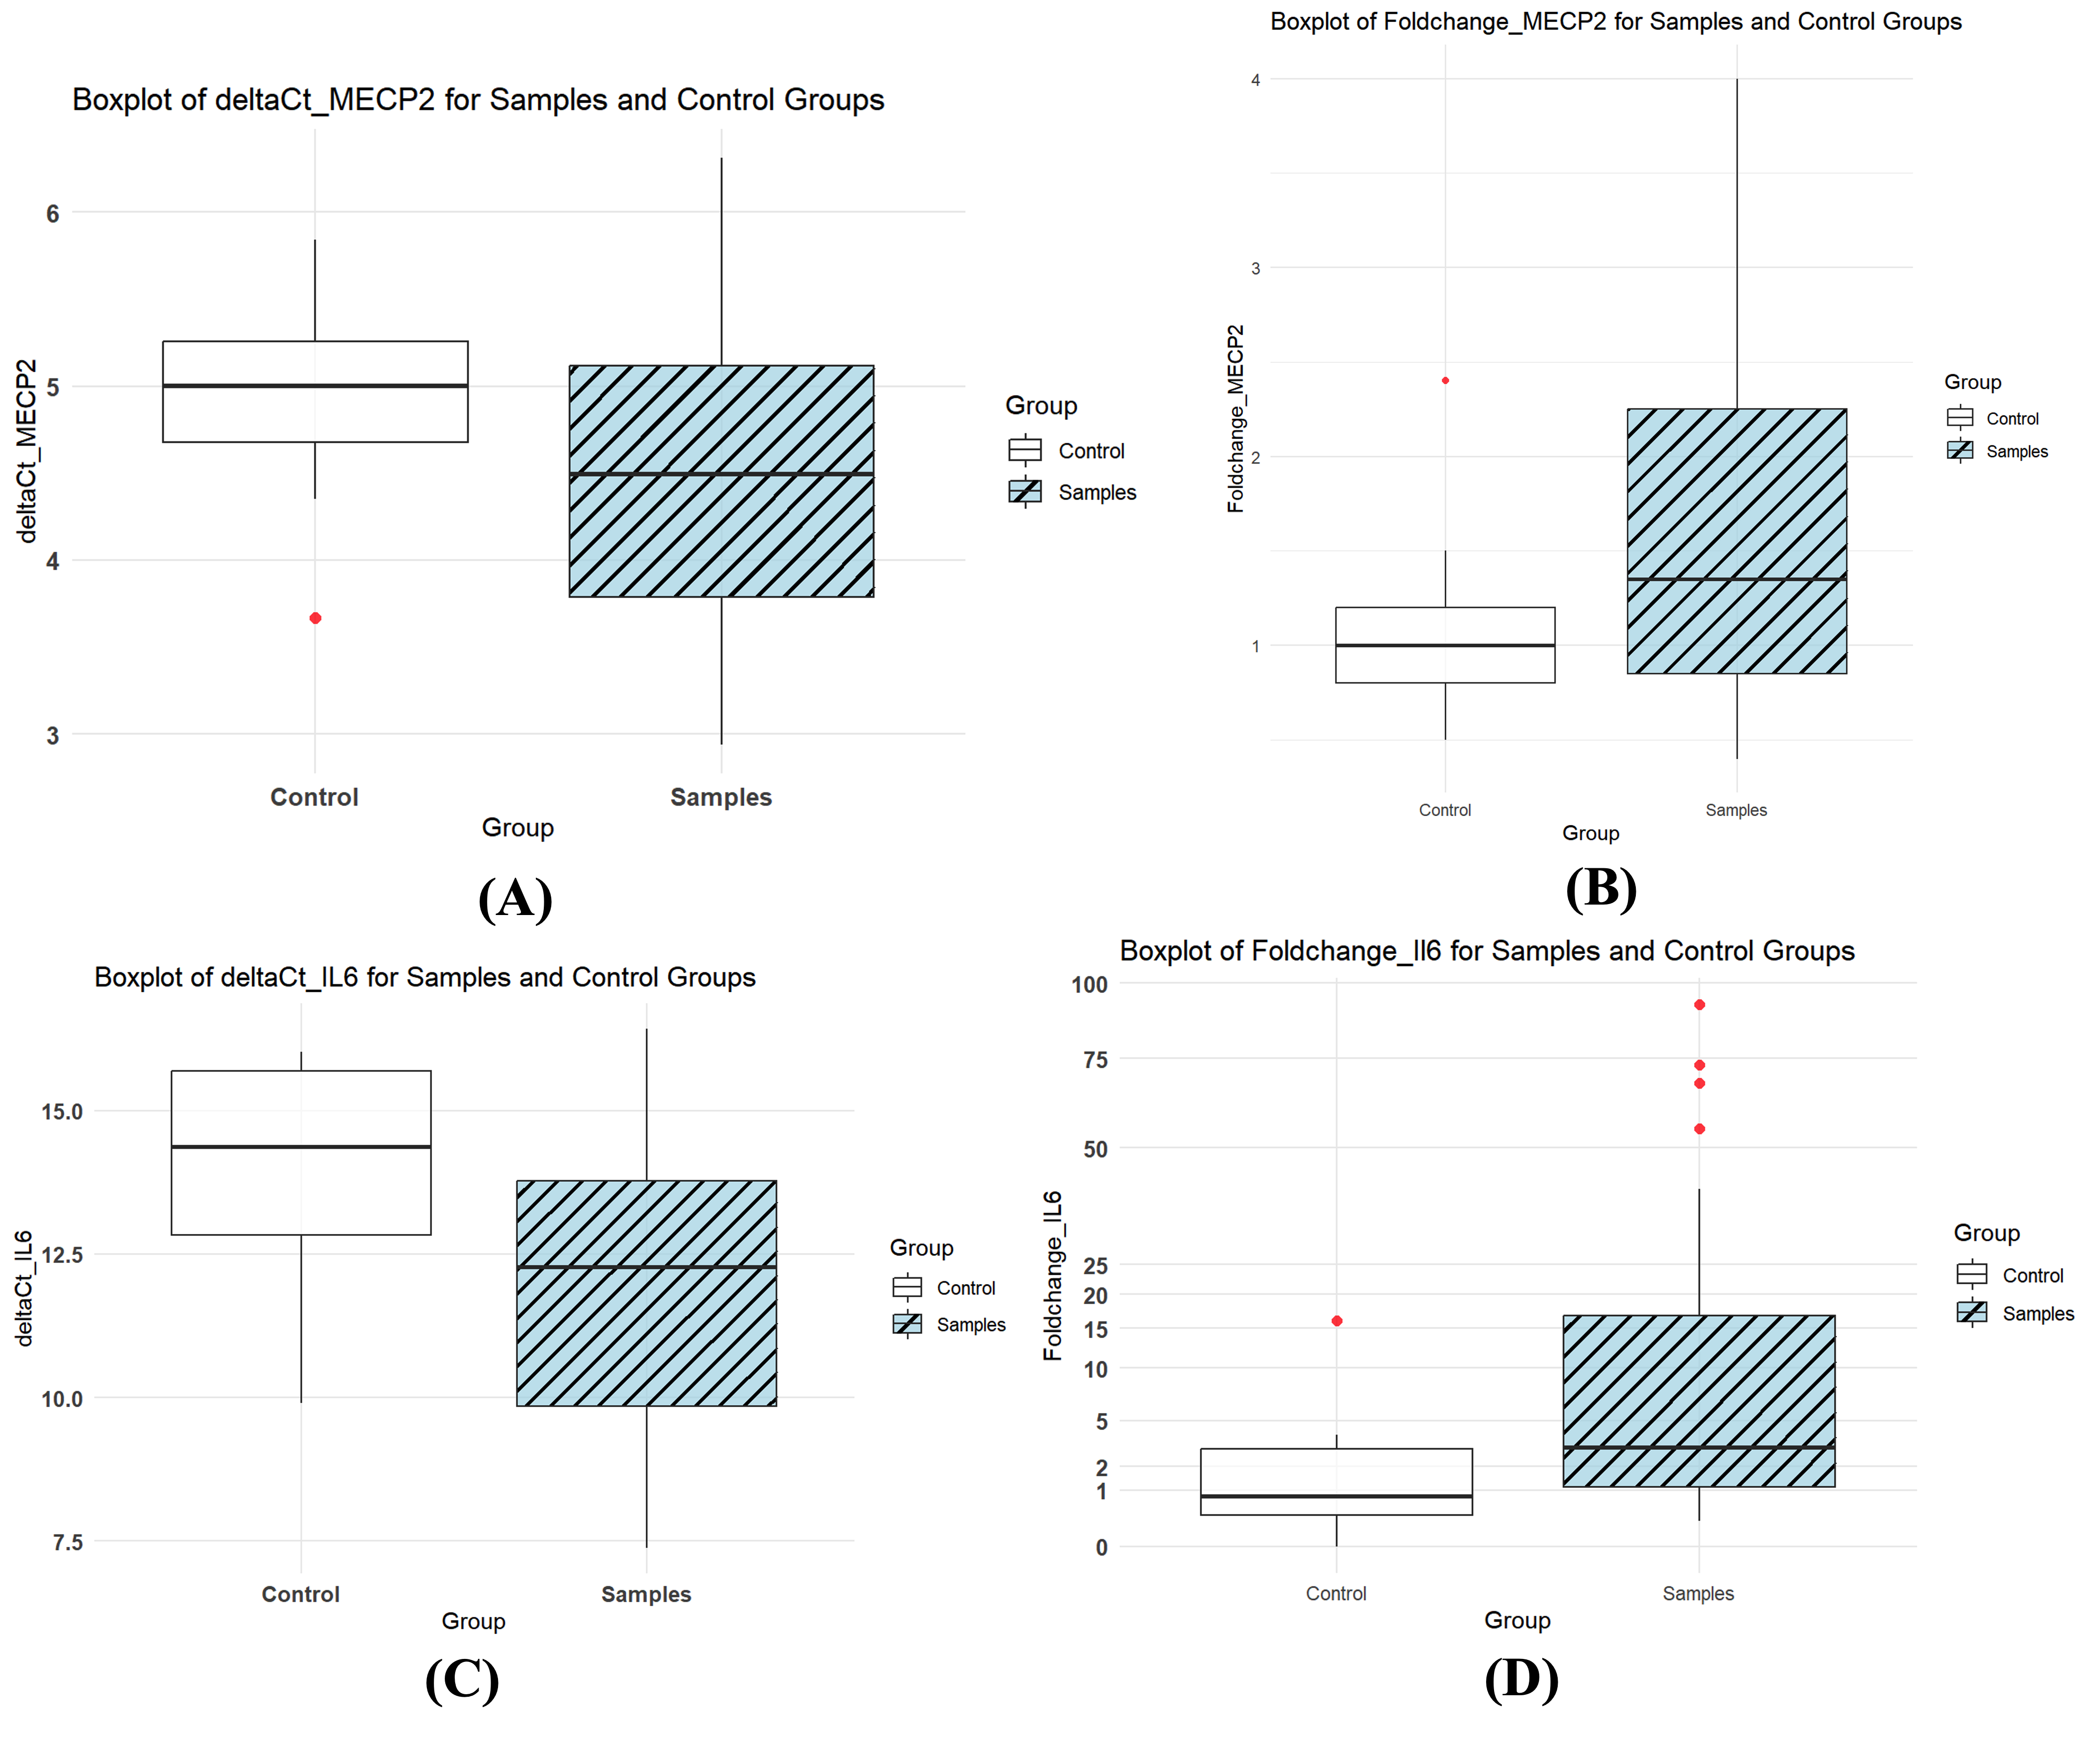
Quantitative assessment of peripheral blood
In contrast, patients with severe depression (SD group) did not exhibit a statistically significant difference in MECP2 expression compared to healthy controls (1.22-fold, H = 0.5229, df = 1, p = 0.4696; N = 33). Direct comparison between the SD group and the mildD group showed a non-significant relative expression ratio of 0.84-fold (H = 0.8448, df = 1, p = 0.3580). Furthermore, MECP2 expression did not differ significantly between female and male depressed patients (female-to-male fold-change = 0.62, H = 2.9936, df = 1, p = 0.0836; N = 34).
Upregulation of IL-6 Expression and Disease Severity Discrepancies
Analysis of peripheral blood IL-6 mRNA expression revealed marked elevation in depressed patients compared with healthy controls (4.47-fold increase, H = 5.4675, df = 1, p = 0.0194; N = 42, comprising 34 patients and 8 controls; Figure 1C, 1D). The 95% confidence interval for the IL-6 fold-change in patients with depression ranged from 7.122 to 23.925. When stratified by clinical severity, the mildD group exhibited a 10.196-fold increase in IL-6 expression compared with controls (H = 8.5291, df = 1, p = 0.0035; N = 27).
Conversely, in patients with severe depression (SD group), IL-6 expression was not significantly elevated compared to healthy controls (1.58-fold, H = 1.3500, df = 1, p = 0.2453; N = 23). Notably, IL-6 expression in the SD group was 6.67-fold lower than that observed in the mildD group (H = 9.6364, df = 1, p = 0.0019; N = 34). A significant sex-dependent difference was also observed, with female depressed patients exhibiting 3.46-fold higher IL-6 expression than male patients (H = 4.0252, df = 1, p = 0.0448; N = 34).
Nonlinear and Correlation Analysis Between MECP2 and IL-6 Expression
To examine the functional relationship between epigenetic regulation and cytokine transcription, GAM regression and bivariate correlation analyses were conducted (Figure 2). Using ΔCt values, GAM regression revealed that IL-6 expression had a weak linear association with MECP2 (ΔCt ~ s(ΔCt): deviance explained = 23.7%, adjusted R = 0.205, p = 0.00354). Conversely, MECP2 exhibited a significant nonlinear relationship with IL-6 (ΔCt ~ s(ΔCt): deviance explained = 38.9%, estimated degrees of freedom [edf] = 2.961, p = 0.0069).
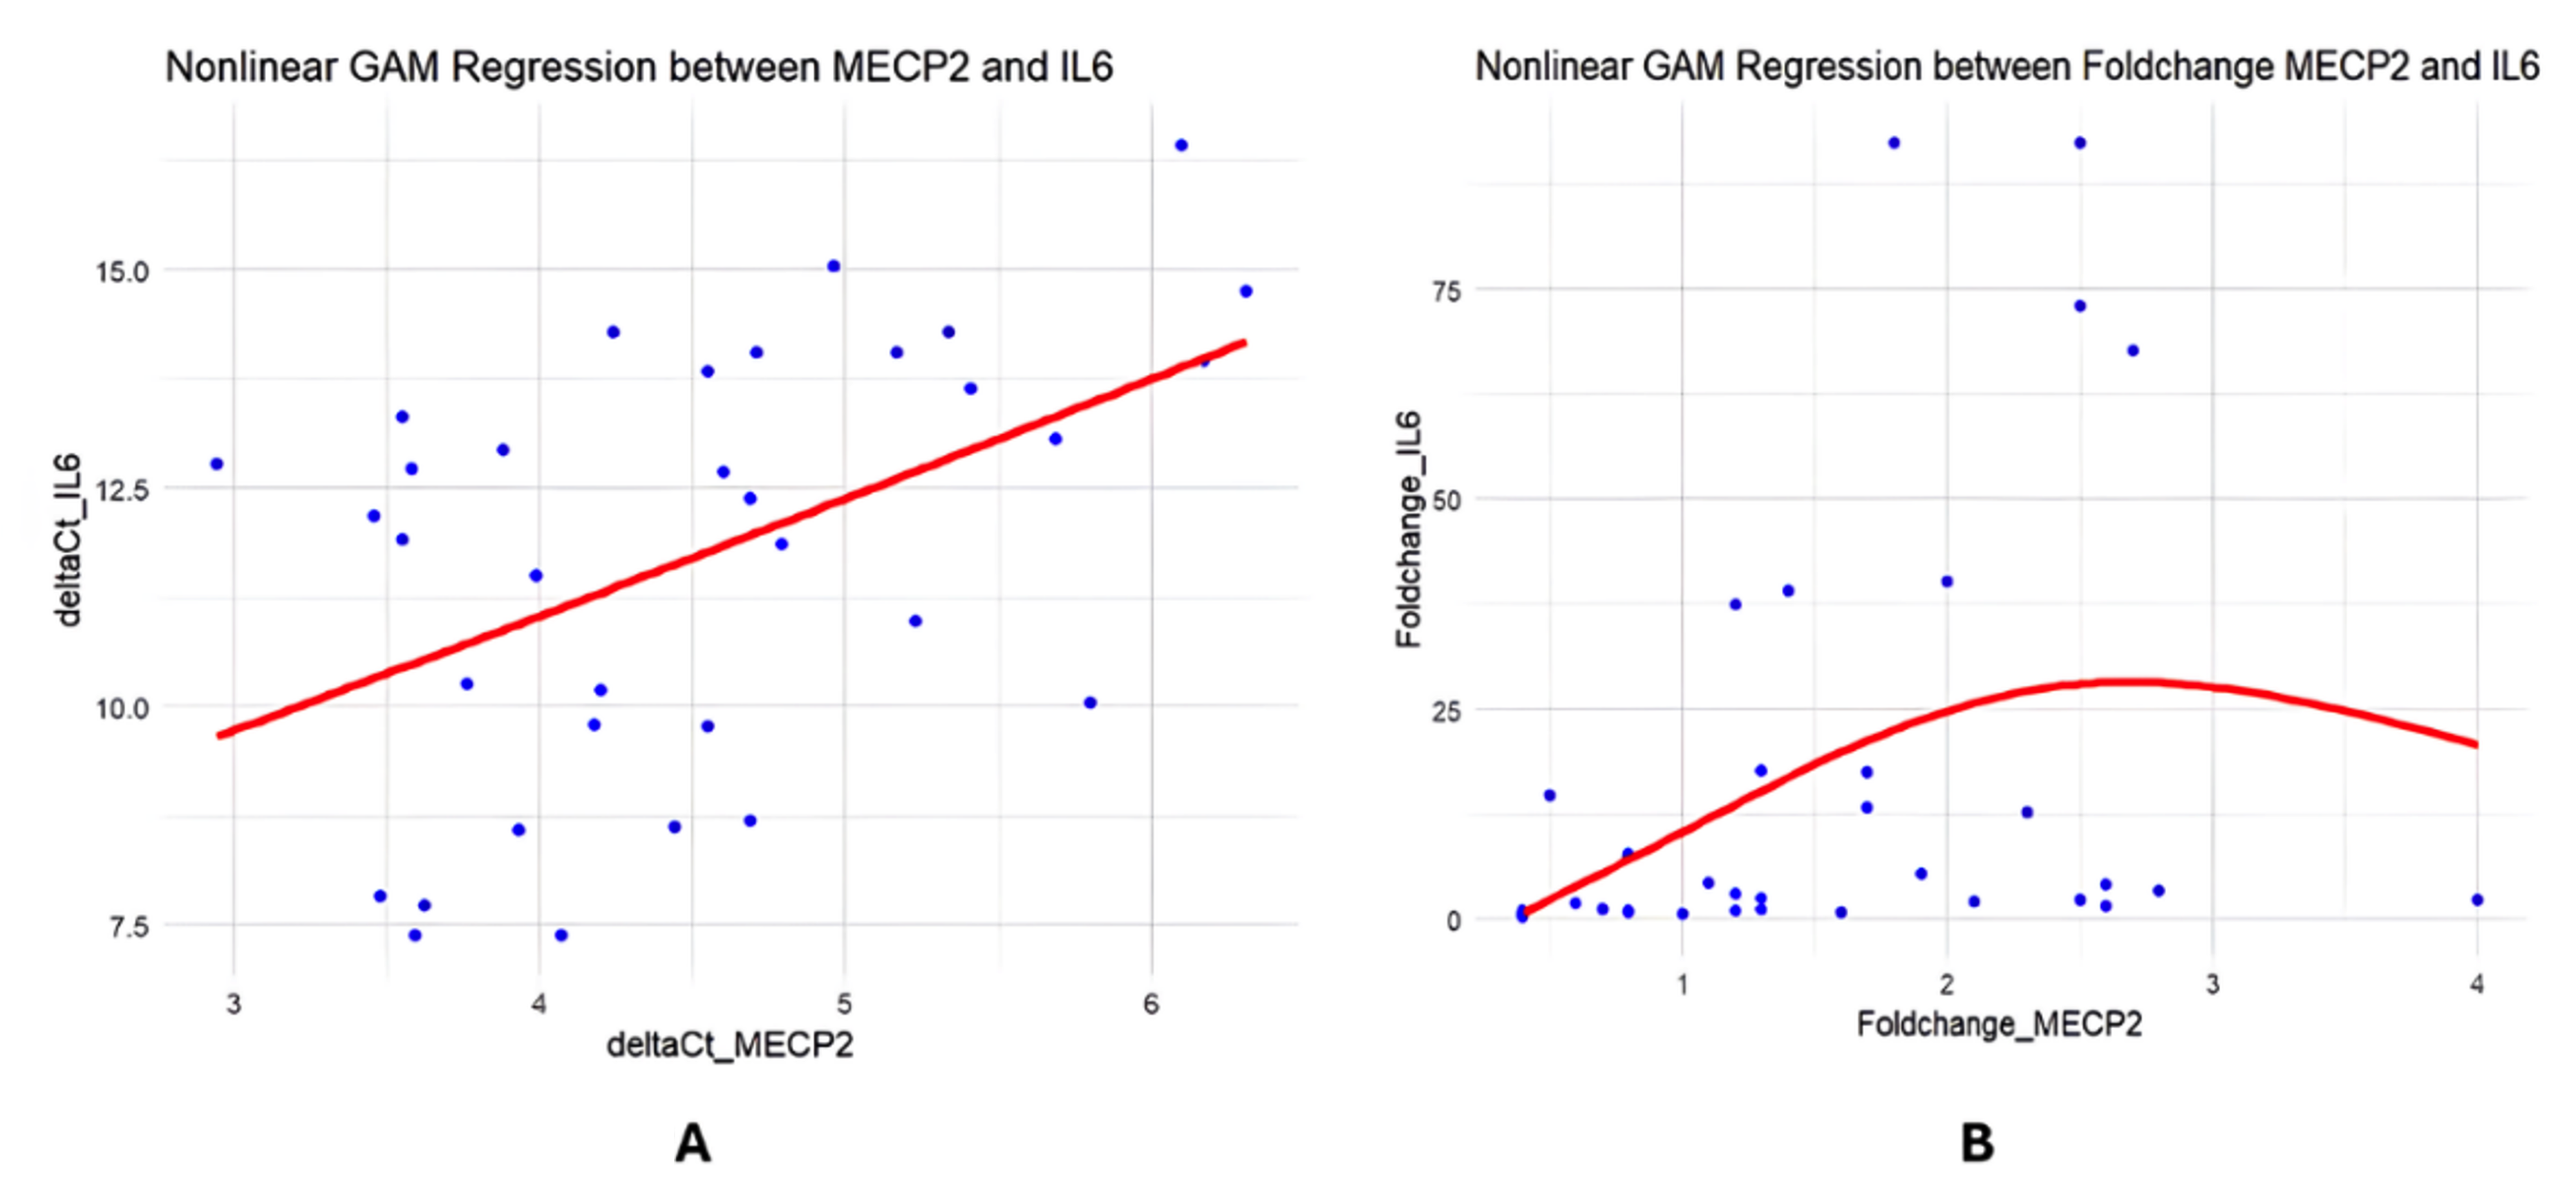
Nonlinear regression models evaluating the relationship between
When evaluating relative fold-change values, the nonlinear GAM model of IL-6 regressed on MECP2 accounted for 19.5% of the deviance (edf = 1.921, p = 0.0782), while MECP2 regressed on IL-6 accounted for 12.1% of the deviance (edf = 1.0, p = 0.0441). Correlation analyses across ΔCt metrics confirmed a statistically significant moderate positive correlation between MECP2 and IL-6 (Spearman's ρ = 0.4887, p = 0.0034; Kendall's τ = 0.3360, p = 0.0050; dCor = 0.4891). Similarly, fold-change values maintained a moderate positive correlation (ρ = 0.4877, p = 0.0034; τ = 0.3357, p = 0.0060; dCor = 0.4282, p = 0.0110), indicating concordant transcriptional co-regulation between MECP2 and IL-6.
Association Between Peripheral IL-6 Expression and Specific PHQ-9 Symptom Domains
In 32 depressed participants with complete and objective psychometric profiles (PHQ-9 scores: 5–27; 20 mild-to-moderate, 12 severe), we analyzed the association between peripheral ΔCt values and individual PHQ-9 items. Bivariate analyses revealed significant positive correlations between ΔCt (where higher ΔCt corresponds to lower relative mRNA expression) and overall depressive symptom burden (ρ = 0.439, p = 0.012; τ = 0.293, p = 0.021; dCor = 0.485, p = 0.008).
Item-level analysis demonstrated that this relationship was driven primarily by three core symptom domains:
-
Anhedonia / Loss of Interest (Q1): ρ = 0.470,
p = 0.007; τ = 0.362,p = 0.009; dCor = 0.469,p = 0.010. -
Depressed Mood / Hopelessness (Q2): ρ = 0.429,
p = 0.010; τ = 0.314,p = 0.023; dCor = 0.544,p = 0.005. -
Sleep Disturbances (Q3): ρ = 0.517,
p = 0.002; τ = 0.402,p = 0.003; dCor = 0.534,p = 0.004.
In addition, feelings of worthlessness or guilt (Q6) displayed a significant association with ΔCt by distance correlation (dCor = 0.534, p = 0.004), although rank correlations did not reach statistical significance (ρ = 0.281, p = 0.119). No significant correlations were observed for fatigue (Q4), appetite changes (Q5), concentration difficulties (Q7), psychomotor agitation/retardation (Q8), or suicidal ideation (Q9).
Discussion
In this study, we evaluated the peripheral blood transcriptional profiles of the epigenetic regulator MECP2 and the pro-inflammatory cytokine IL-6 in young Vietnamese patients with depressive disorders. Our findings demonstrate significant upregulation of both MECP2 and IL-6 in patients with mild-to-moderate depression, whereas expression in severe depression did not differ significantly from healthy controls. Furthermore, we identified a moderate positive correlation between MECP2 and IL-6 expression and established significant associations between peripheral IL-6 levels and specific clinical symptom dimensions, notably anhedonia, depressed mood, and sleep disturbance.
Although minor carryover of guanidine salts during silica column extraction resulted in sub-optimal A260/A230 ratios in some clinical samples, rigorous qPCR quality controls—including standard curves exhibiting efficiencies between 95.3% and 98.6% with R > 0.90—confirmed that assay performance was uncompromised. Intra-group variance for baseline IL-6 expression in controls was low (Z-score < 1.96, p > 0.05), validating the reliability of relative quantification via the 2 method. Although the evaluable healthy control sample size for IL-6 was limited to N = 8 due to sample attrition and ethical constraints regarding re-sampling, non-parametric rank tests and bootstrap-based distance correlations confirmed sufficient statistical power to detect meaningful biological differences.
MECP2 is an indispensable regulator of synaptic plasticity, dendritic spine architecture, and neural circuit adaptation12,13. Epigenetic modulation involving MECP2 isoforms (such as MECP2-e1) has been implicated in altered stress reactivity and vulnerability to trauma13,14. Concurrently, IL-6 serves as a key neuroimmune messenger that modulates HPA axis hyperactivity and monoaminergic neurotransmission14,15. Elevated peripheral IL-6 concentrations are well-documented across depressive cohorts15,16,17,18, with several studies reporting positive correlations between IL-6 levels and depressive symptom severity17,18. Notably, our results revealed marked IL-6 upregulation in mild-to-moderate depression, but an absence of significant elevation in severe cases. This pattern is consistent with reports indicating that cytokine dysregulation in MDD does not invariably follow a linear trajectory across disease stages19. In chronic or severe depressive states, neuroimmune exhaustion, allostatic burnout, or compensatory epigenetic silencing may attenuate peripheral cytokine transcription.
The observed sex-dependent difference—wherein female patients exhibited 3.46-fold higher IL-6 expression than male patients—further underscores the sexually dimorphic nature of neuroimmune responses in depression, consistent with previous clinical literature10,18.
Mechanistically, IL-6 exerts profound downstream effects on monoaminergic neurotransmission. IL-6 signaling dampens 5-HT2A receptor sensitivity via JAK/STAT pathway activation20, thereby disrupting serotonergic signaling essential for affective stability21. Concurrently, neuroinflammatory cascades alter noradrenergic pathways governing arousal and limbic reactivity22 and impair mesolimbic dopaminergic signaling underlying reward processing and motivation23. These neurochemical interactions provide a plausible biological mechanism for our finding that IL-6 expression correlated specifically with PHQ-9 items measuring anhedonia (Q1), depressed mood (Q2), and sleep disturbance (Q3). These findings corroborate the clinical utility of the PHQ-9 instrument by linking psychometric symptom clusters directly to underlying molecular inflammatory alterations.
Epigenetic mechanisms provide a critical link between chronic stress exposure and sustained immune dysregulation24. In immune cells, MECP2 binds to methylated CpG islands within the IL-6 promoter, recruiting corepressor complexes that block transcriptional activators such as p300, thereby repressing IL-6 transcription9,25. However, MECP2 function appears highly cell-type and context-dependent. While MECP2 overexpression increases IL-6 production in human monocytic THP-1 cells25, MECP2 deficiency in astrocytes triggers spontaneous IL-6 overproduction that impairs synaptogenesis26. In our cohort, the initial concurrent upregulation of MECP2 and IL-6 in mild depression, followed by their attenuation in severe depression, suggests a dynamic compensatory response wherein MECP2 is upregulated to restrain acute cytokine surges, but becomes dysregulated or uncoupled during prolonged, severe illness.
Study Limitations
Several limitations should be considered when interpreting these findings. First, the sample size was relatively small (N = 34 patients, N = 18 controls for MECP2, N = 8 controls for IL-6), which limited the statistical power for extensive stratified sub-analyses. Second, the cross-sectional design precludes causal inferences regarding whether MECP2 and IL-6 alterations cause depressive onset or represent secondary biological adaptations. Longitudinal studies tracking MECP2 and cytokine dynamics before and after therapeutic intervention in larger, multi-center cohorts are warranted.
Conclusions
This study demonstrates that peripheral blood mRNA expression of MECP2 and IL-6 is significantly altered in young Vietnamese individuals with depression, characterized by pronounced upregulation during mild-to-moderate stages and subsequent normalization in severe depression. Furthermore, MECP2 and IL-6 exhibit a significant moderate correlation, and peripheral IL-6 expression correlates selectively with core depressive symptom domains, including anhedonia, depressed mood, and sleep disturbance. These preliminary findings highlight the potential role of epigenetic and neuroimmune interactions in depressive pathophysiology and provide a molecular foundation for biomarker discovery in youth depression.
Abbreviations
5-HT: 5-Hydroxytryptamine (Serotonin); 5mC: 5-Methylcytosine; 5hmC: 5-Hydroxymethylcytosine; cDNA: Complementary Deoxyribonucleic Acid; CI: Confidence Interval; Ct: Cycle Threshold; DA: Dopamine; dCor: Distance Correlation; df: Degrees of Freedom; DSM-5: Diagnostic and Statistical Manual of Mental Disorders, Fifth Edition; EDTA: Ethylenediaminetetraacetic Acid; GAM: Generalized Additive Model; HPA: Hypothalamic-Pituitary-Adrenal; IL-6: Interleukin-6; IL-1β: Interleukin-1 Beta; IRB: Institutional Review Board; JAK/STAT: Janus Kinase / Signal Transducer and Activator of Transcription; MDD: Major Depressive Disorder; MECP2: Methyl-CpG Binding Protein 2; NE: Norepinephrine; PBMC: Peripheral Blood Mononuclear Cell; PHQ-9: 9-Item Patient Health Questionnaire; qPCR: Quantitative Real-Time Polymerase Chain Reaction; RNA: Ribonucleic Acid; RT-qPCR: Reverse Transcription Quantitative Real-Time Polymerase Chain Reaction; SD: Severe Depression; snU6: Small Nuclear RNA U6; STAT3: Signal Transducer and Activator of Transcription 3; TNF-α: Tumor Necrosis Factor-Alpha.
Acknowledgments
We sincerely thank the University of Health Sciences, Vietnam National University Ho Chi Minh City, and the Psychiatric Hospital of Ho Chi Minh City for their administrative and institutional support. We also express our sincere gratitude to the students who participated as healthy control subjects in this study.
Author’s contributions
HHTD: Conceptualized and designed the study, performed data interpretation, drafted the initial manuscript, and revised the final text. LLT: Formulated the study rationale, conducted clinical psychiatric evaluations, and collected clinical patient specimens. HPT, TNTM: Processed biological samples, conducted RNA isolation and RT-qPCR experiments, and curated experimental datasets. PTK, DTNT, NLNT: Conducted clinical psychiatric screenings and assisted in patient recruitment and sample acquisition. TLTD: Coordinated clinical specimen logistics and verified laboratory and experimental data integrity. HDTT, NNM: Performed statistical analyses, conducted critical manuscript revisions, and contributed to final proofreading. All authors read and approved the final version of the manuscript.
Funding
This research was funded by Vietnam National University Ho Chi Minh City (VNU-HCM) under grant number C2024-44-22.
Availability of data and materials
All relevant datasets generated and analyzed during this study are included within the manuscript and its supplementary files (Table 1 and Appendix 1). Additional raw data files are available from the corresponding author upon reasonable request.
Ethics approval and consent to participate
Ethical approval for this study was granted by the Institutional Review Board (IRB) under Decision Number 07/QĐ-IRB-VN01.017. All adult participants provided written informed consent. For participants under 18 years of age, written informed assent was obtained alongside written informed consent from their parents or legal guardians prior to enrollment.
Consent for publication
Not applicable.
Declaration of generative AI and AI-assisted technologies in the writing process
During the preparation of this manuscript, the authors used Google Gemini solely for language editing, grammatical correction, and academic readability enhancement. The authors thoroughly reviewed and edited the output and assume full responsibility for the content, accuracy, and scientific integrity of the final publication.
Competing interests
The authors declare that they have no competing interests.