


Prognostic Hub Genes as Potential Biomarkers in Breast Cancer Identified through Bioinformatics Analysis

- Department of Medical Biotechnology, Faculty of Medicine, Semnan University of Medical Sciences, Semnan, Iran
- Department of Epidemiology and Biostatistics, Faculty of Medicine, Semnan University of Medical Sciences, Semnan, Iran
- Department of Hematology, Medical Oncology and Stem Cell Transplantation, Shiraz University of Medical Sciences, Shiraz, Iran
Abstract
Background: Hub genes play central roles in molecular interaction networks and may serve as prognostic biomarkers in breast cancer (BC). This study aimed to identify key hub genes associated with prognosis and clinicopathological features in BC, with an emphasis on the molecular subtype context.
Methods: Two GEO datasets (GSE231629 and GSE3744) were analyzed to identify common differentially expressed genes (DEGs) between BC and normal tissues. A protein-protein interaction network was constructed, and hub genes were identified using cytoHubba. Regulatory networks were predicted via ENCORI, miRTargetLink 2.0, and TRRUST. Survival analysis was stratified by PAM50 molecular subtypes.
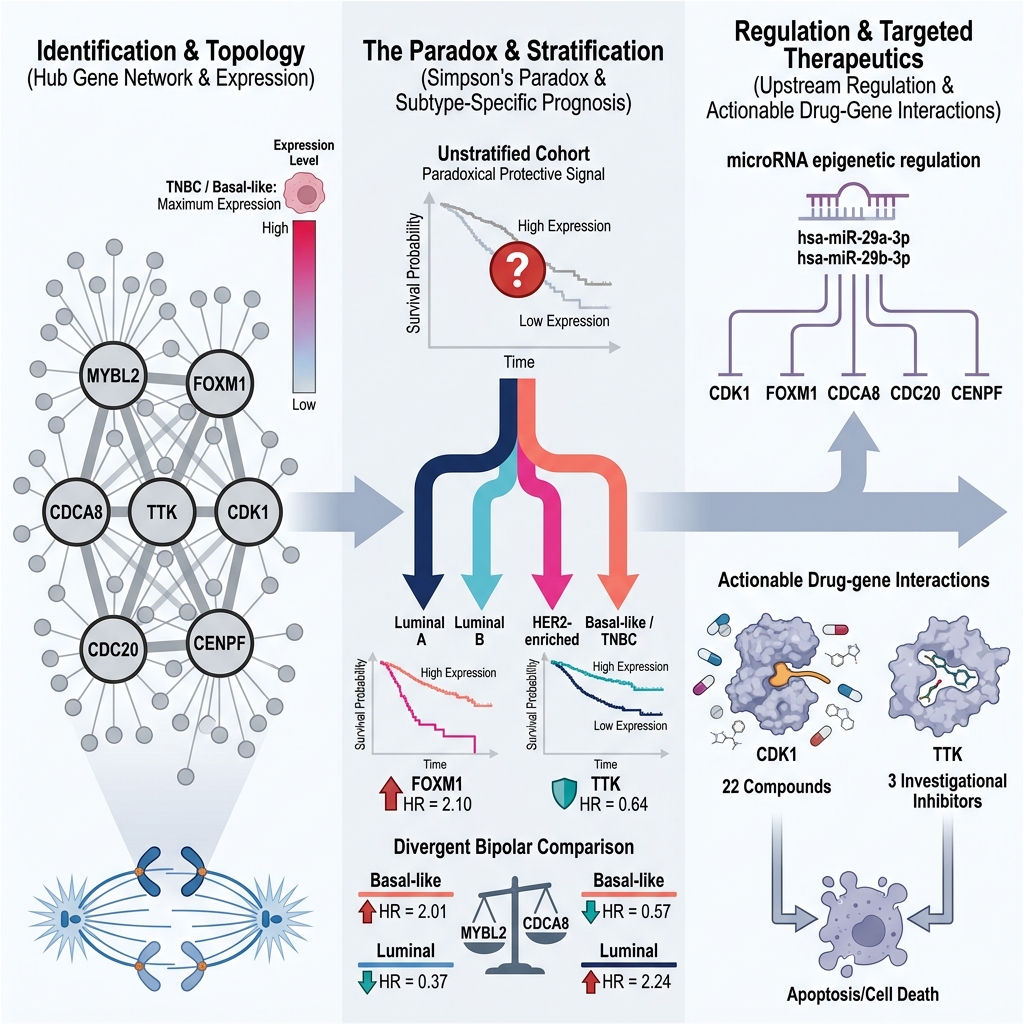
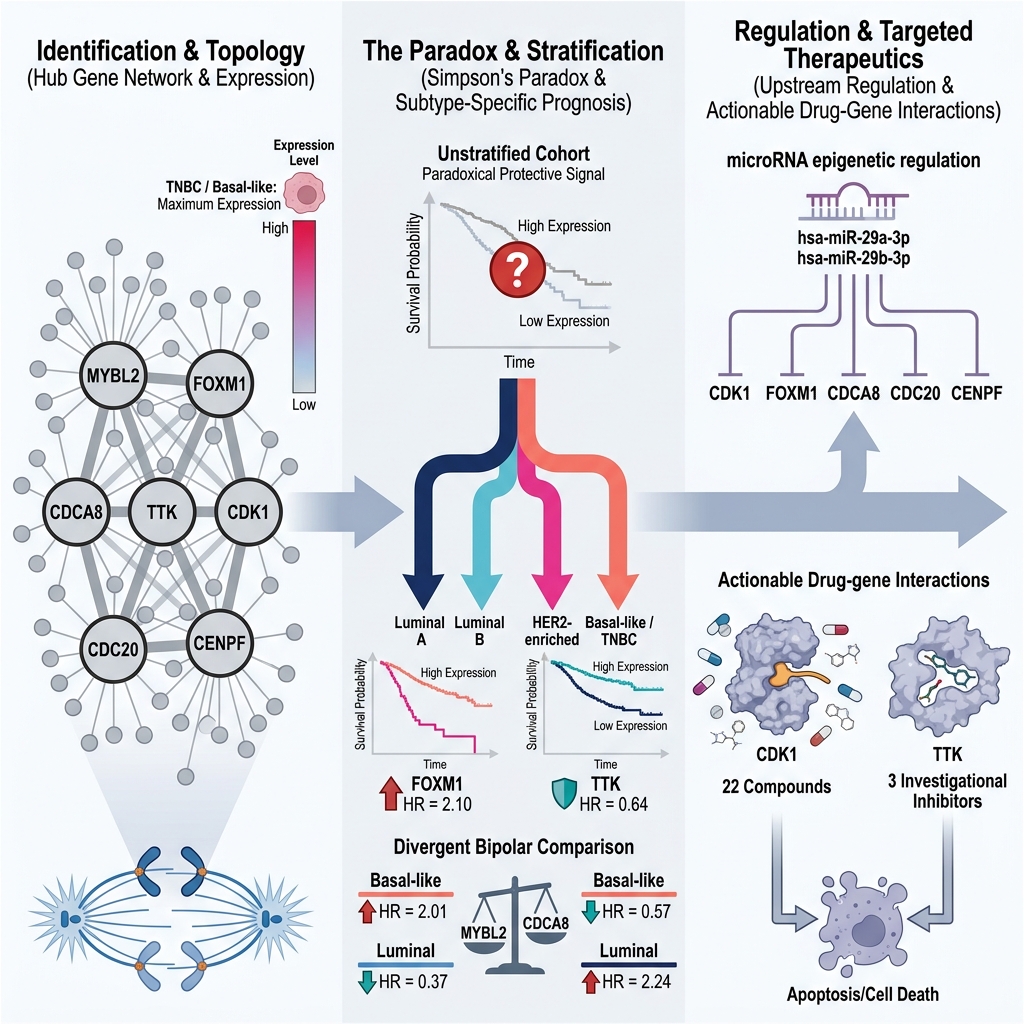
Results: We identified 93 common DEGs, leading to seven hub genes: MYBL2, FOXM1, CDK1, TTK, CDCA8, CDC20, and CENPF. All seven genes were significantly overexpressed in BC tissues, with markedly higher expression in triple-negative breast cancer. While unstratified survival analysis initially suggested paradoxical protective effects for FOXM1, CDC20, CDK1, and TTK (HR < 1), subtype-stratified analysis resolved this. FOXM1 was significantly linked to poor prognosis solely in the HER2-enriched subtype (HR = 2.1, p = 0.049). CDCA8 showed opposing effects: protective in basal-like (HR = 0.57, p = 0.027) but risk-associated in HER2-enriched (HR = 2.24, p = 0.0044) and luminal subtypes. MYBL2 displayed a striking dichotomy: risk-associated in basal-like (HR = 2.01, p = 0.039) and strongly protective in luminal A (HR = 0.37, p = 1.6e-5) and luminal B (HR = 0.25, p = 0.00046). Functional enrichment linked these genes to cell division and cell cycle pathways. Regulatory analysis identified hsa-miR-29a-3p as a key miRNA targeting multiple hubs, and predicted FOXM1 and MYBL2 as significant transcription factors.
Conclusion: The prognostic significance of BC hub genes is strongly subtype-dependent. Molecular stratification is essential for accurate prognostic biomarker discovery in heterogeneous cancers.
Graphical abstract
Introduction
Breast cancer (BC) remains the most commonly diagnosed malignancy and a leading cause of cancer-related mortality among women globally1. Despite significant advances in multimodal treatment strategies, including surgery, chemotherapy, hormone therapy, and radiotherapy, the clinical management of BC continues to be challenged by high rates of tumor recurrence and the development of therapy resistance2,3. Early-stage disease is often asymptomatic, and late diagnosis substantially diminishes the effectiveness of therapeutic interventions, leading to poorer outcomes4. Consequently, the early detection of BC and the accurate stratification of patient prognosis are critical for improving therapeutic efficacy and long-term survival. Reliable prognostic biomarkers can guide clinical decision-making, particularly in cases where curative options are limited, enabling a more personalized approach to treatment5. Currently, the classification of BC and the selection of targeted therapies rely on well-established biomarkers such as the estrogen receptor (ER), progesterone receptor (PR), and human epidermal growth factor receptor 2 (HER2) status6. Additionally, the proliferation marker Ki-67 is widely used to assess tumor aggressiveness and predict response to systemic therapies7. While these markers provide valuable clinical information, they do not fully capture the profound molecular heterogeneity of BC. This limitation underscores the urgent need to identify novel and robust molecular indicators that can complement existing biomarkers, refine prognostic accuracy, and ultimately guide more effective, individualized treatment strategies.
In recent years, molecular network analysis has emerged as a powerful bioinformatics approach to decipher the complex genetic mechanisms driving cancer development and progression. By mapping interactions between genes based on co-expression patterns or protein-protein associations, these networks provide a systems-level understanding of cellular processes. Within such networks, certain genes occupy highly central positions with extensive connectivity; these are referred to as hub genes8. Hub genes often function as critical regulators of cellular homeostasis and key signaling pathways9. Due to their central roles, alterations in hub genes can destabilize entire molecular networks, disrupt normal cellular functions, and contribute to disease states, including oncogenesis10. The identification of hub genes is therefore of particular importance in cancer research, as they frequently serve as pivotal drivers of tumorigenesis and represent promising candidates for therapeutic targeting. Classic examples such as TP53, BRCA1, and MYC illustrate this principle, demonstrating how hub genes can influence a wide array of downstream processes, including cell proliferation, apoptosis, and genomic stability, through their central network positions11. The integration of advanced computational tools has significantly accelerated the discovery and functional characterization of hub genes in cancer. For instance, Weighted Gene Co-expression Network Analysis (WGCNA) facilitates the construction of co-expression networks and identifies key modules and hub genes associated with specific phenotypes12. Similarly, protein-protein interaction databases such as STRING provide comprehensive, evidence-based interaction maps that help pinpoint highly connected genes within biological networks13. By leveraging these resources, researchers can systematically identify hub genes that may play essential roles in cancer pathophysiology.
Importantly, a major challenge in the discovery of prognostic biomarkers in BC is the profound molecular heterogeneity of the disease. The four intrinsic Prediction Analysis of Microarray 50 (PAM50) subtypes (basal-like, HER2-enriched, luminal A, and luminal B) differ substantially in their genetic drivers, clinical behavior, and treatment response. A gene that serves as a risk factor in one subtype may be neutral or even protective in another. Failure to account for this heterogeneity can lead to misleading or paradoxical prognostic associations, resembling a form of Simpson's paradox where aggregate trends reverse when the population is appropriately stratified. Therefore, in this study, we not only identify hub genes but also systematically evaluate their prognostic effects within each PAM50 subtype.
This study employed an integrated bioinformatics pipeline to identify and characterize prognostic hub genes in BC. We analyzed gene expression profiles from public datasets to identify differentially expressed genes (DEGs) between tumor and adjacent normal tissues. Protein-protein interaction networks were constructed using the STRING database, and hub genes were extracted based on network topology. The clinical relevance of these hub genes was further evaluated by examining their expression patterns across BC molecular subtypes, their correlation with key clinicopathological features, and their subtype-specific association with patient survival outcomes. We hypothesized that this systematic approach would uncover novel molecular drivers of BC progression and identify robust prognostic biomarkers with therapeutic potential, while also demonstrating the critical importance of subtype stratification.
Materials and Methods
Data Collection and Processing
Gene expression datasets were retrieved from the Gene Expression Omnibus (GEO) database at the National Center for Biotechnology Information (NCBI; ). Two independent microarray datasets were selected for this in silico analysis: GSE231629 (containing 109 samples) and GSE3744 (containing 47 samples). The selection of these specific datasets was based on three criteria: (1) both datasets were generated on the same Affymetrix GPL570 platform ([HG-U133_Plus_2] Array), eliminating cross-platform batch effects without requiring additional normalization; (2) each dataset provided paired or adjacent normal breast tissue controls, which are not universally available in larger repositories; and (3) the smaller sample size of GSE3744 served as a conservative validation set to ensure that identified DEGs were not artifacts of a single large cohort. We acknowledge that larger cohorts such as TCGA (n > 1000) and METABRIC (n ~ 2000) exist. However, in the present study, TCGA data were intentionally reserved for independent validation of expression patterns (via GEPIA/UALCAN) and survival analysis (via Kaplan-Meier Plotter, which incorporates TCGA and GEO datasets). This two-stage design (discovery in smaller, well-matched GEO cohorts followed by validation in large-scale repositories) minimizes the risk of overfitting and ensures generalizability. Since the present analyses were performed on microarray data that had been pre-processed and normalized by the GEO platform, and given the use of an identical platform for both datasets, no additional normalization or batch effect correction was applied. All databases were accessed between January and February 2025. To ensure the reproducibility and currency of our findings, we re-analyzed the key results using the most current versions of these platforms as of May 2026. No significant changes in the direction or magnitude of hazard ratios or DEG lists were observed, confirming the stability of our conclusions.
Identification of Differentially Expressed Genes
Differentially expressed genes between BC and adjacent normal tissues were identified separately for each dataset using the interactive web tool GEO2R (accessed January 2025). GEO2R employs the limma R package to perform linear model analysis on the normalized GEO series matrix data. Genes with an adjusted p-value (Benjamini & Hochberg false discovery rate) < 0.01 and |log2-fold change| (|log2FC|) > 114,15 were selected as DEGs.
Protein-Protein Interaction Network and Hub Gene Identification
The list of common DEGs present in both datasets was submitted to the STRING database (version 11.5; ) to construct a protein-protein interaction (PPI) network16. For the identification of significant interactions within the PPI network, a combined score > 0.4 from the STRING database was considered. This threshold, consistent with common practices in similar studies, indicates a medium to high level of confidence in the reliability of the predicted interactions16. The resulting network file was downloaded and imported into Cytoscape software (version 3.9.1) for visualization and further analysis. Hub genes within the PPI network were identified using the cytoHubba plugin (version 0.1). The top-ranking nodes from each of eight distinct topological algorithms (Maximum Clique Centrality [MCC], Maximum Neighborhood Component [MNC], Density of Maximum Neighborhood Component [DMNC], Degree, Closeness, Bottleneck, Eccentricity, and Edge Percolated Component [EPC]) were extracted. Genes that consistently appeared among the top 10 nodes across the majority of these algorithms were selected as candidate hub genes for downstream analysis.
Functional and Pathway Enrichment Analysis
Gene Ontology (GO) and Kyoto Encyclopedia of Genes and Genomes (KEGG) pathway enrichment analyses were performed for the common DEGs using the Database for Annotation, Visualization and Integrated Discovery (DAVID, version 6.8; ). The analysis included Biological Process (BP), Molecular Function (MF), and Cellular Component (CC) categories from GO. Terms with a Benjamini-Hochberg-adjusted p-value < 0.05 were considered significantly enriched.
Survival Analysis
The prognostic value of the identified hub genes was assessed using the Kaplan-Meier Plotter online tool (, accessed February 2025, re-verified May 2026). The BC dataset was selected. Two complementary survival analyses were performed:
First, an unstratified analysis using the median cutoff option to dichotomize patients into high- and low-expression groups based on the probe with the most significant prognostic value (Jetset best probe). Hazard ratios (HR) with 95% confidence intervals and log-rank p-values were calculated and extracted directly from the tool.
Second, and more importantly, a subtype-stratified analysis was performed by splitting patients according to PAM50 molecular subtypes (basal-like, HER2-enriched, luminal A, luminal B) using the built-in subtype annotation in Kaplan-Meier Plotter. This stratification was conducted to investigate whether the prognostic effects of the hub genes were context-dependent and to resolve potential paradoxical findings from the unstratified analysis. Hazard ratios and p-values were calculated separately for each subtype.
Analysis of Clinical Features
The correlations of hub genes with clinicopathological parameters, such as tumor subtypes, were analyzed using UALCAN (, accessed February 2025, re-verified May 2026), a portal for The Cancer Genome Atlas (TCGA) data.
miRNA-mRNA Regulatory Network Analysis
Experimentally validated miRNA-mRNA interactions for the hub genes were retrieved from the ENCORI (starbase.sysu.edu.cn) and miRTargetLink 2.0 () databases. The search criteria in ENCORI were set to: strict stringency (CLIP-Data >= 5), with only experimentally validated miRNA-mRNA interactions with strong evidence (supported by reporter assays, Western blots, or qPCR) being included.
Prediction of Transcriptional Regulators
Transcription factors (TFs) regulating the hub genes were predicted using the TRRUST database (version 2; ). This database contains manually curated transcriptional regulatory networks for humans. All predicted TFs with documented regulatory relationships (activation or repression) were recorded17.
Prediction of Drug-Gene Interactions
Potential pharmacological agents targeting the hub genes were identified using the Drug-Gene Interaction Database (DGIdb, version 4.2.0; ). The search was conducted using default parameters, and all predicted interactions, along with their interaction scores and sources, were compiled for analysis.
Results
Identification of Differentially Expressed Genes and Hub Proteins
Differential expression analysis of the two GEO datasets (GSE3744 and GSE231629) identified 2360 and 1140 DEGs, respectively, as shown in Figure 1A-B. A comparative analysis revealed 93 genes that were consistently differentially expressed in both datasets, as shown in Figure 1C. To elucidate the functional relationships among these common DEGs, a PPI network was constructed using the STRING database. The resulting network, comprising 93 nodes and 226 edges, was imported into Cytoscape for topological analysis (Supplementary material S1). Hub genes within this network were identified by integrating results from eight topological algorithms (MCC, MNC, DMNC, Degree, Closeness, Bottleneck, ECC, and EPC) using the cytoHubba plugin. An UpSet plot analysis was employed to evaluate consensus, revealing seven key hub genes: CDK1, CDC20, CDCA8, and CENPF, which showed consensus across all eight algorithms, along with TTK, FOXM1, and MYBL2, whose results are detailed in Figure 2. These hub genes exhibited the highest degree of connectivity within the PPI network, suggesting their central regulatory roles.
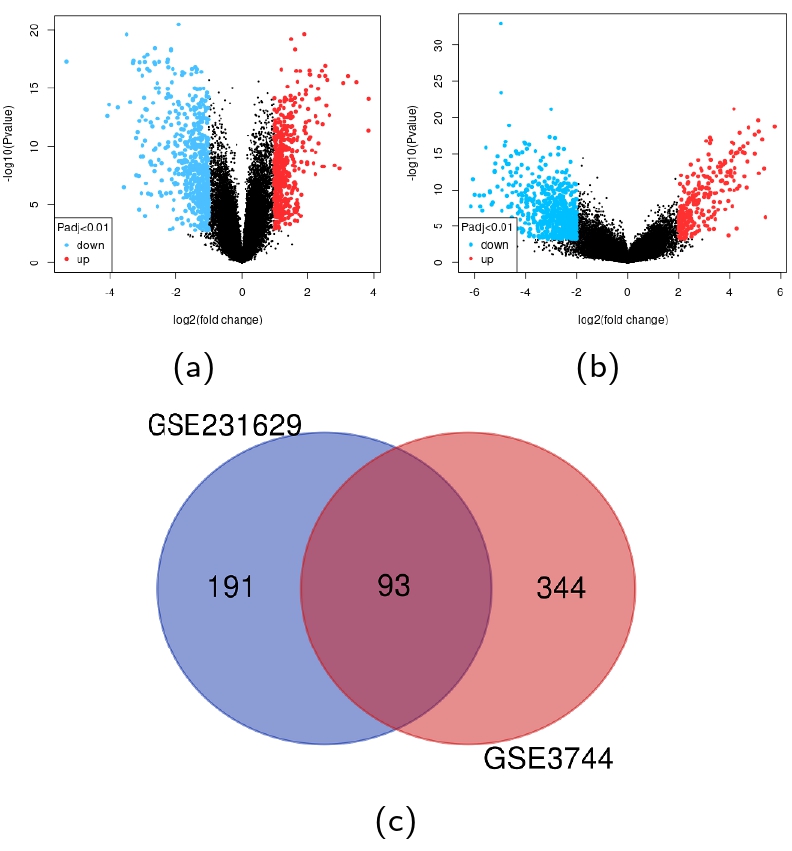
Identification of DEGs in GSE231629 and GSE3744. The volcano plots showing all the expressed genes from GSE231629 and GSE3744, respectively (A-B). The Venn diagram of Common genes between GSE231629 and GSE3744 (C). P-value < 0.01 and (|log2FC|) ≥ 1 were considered statistically significant.
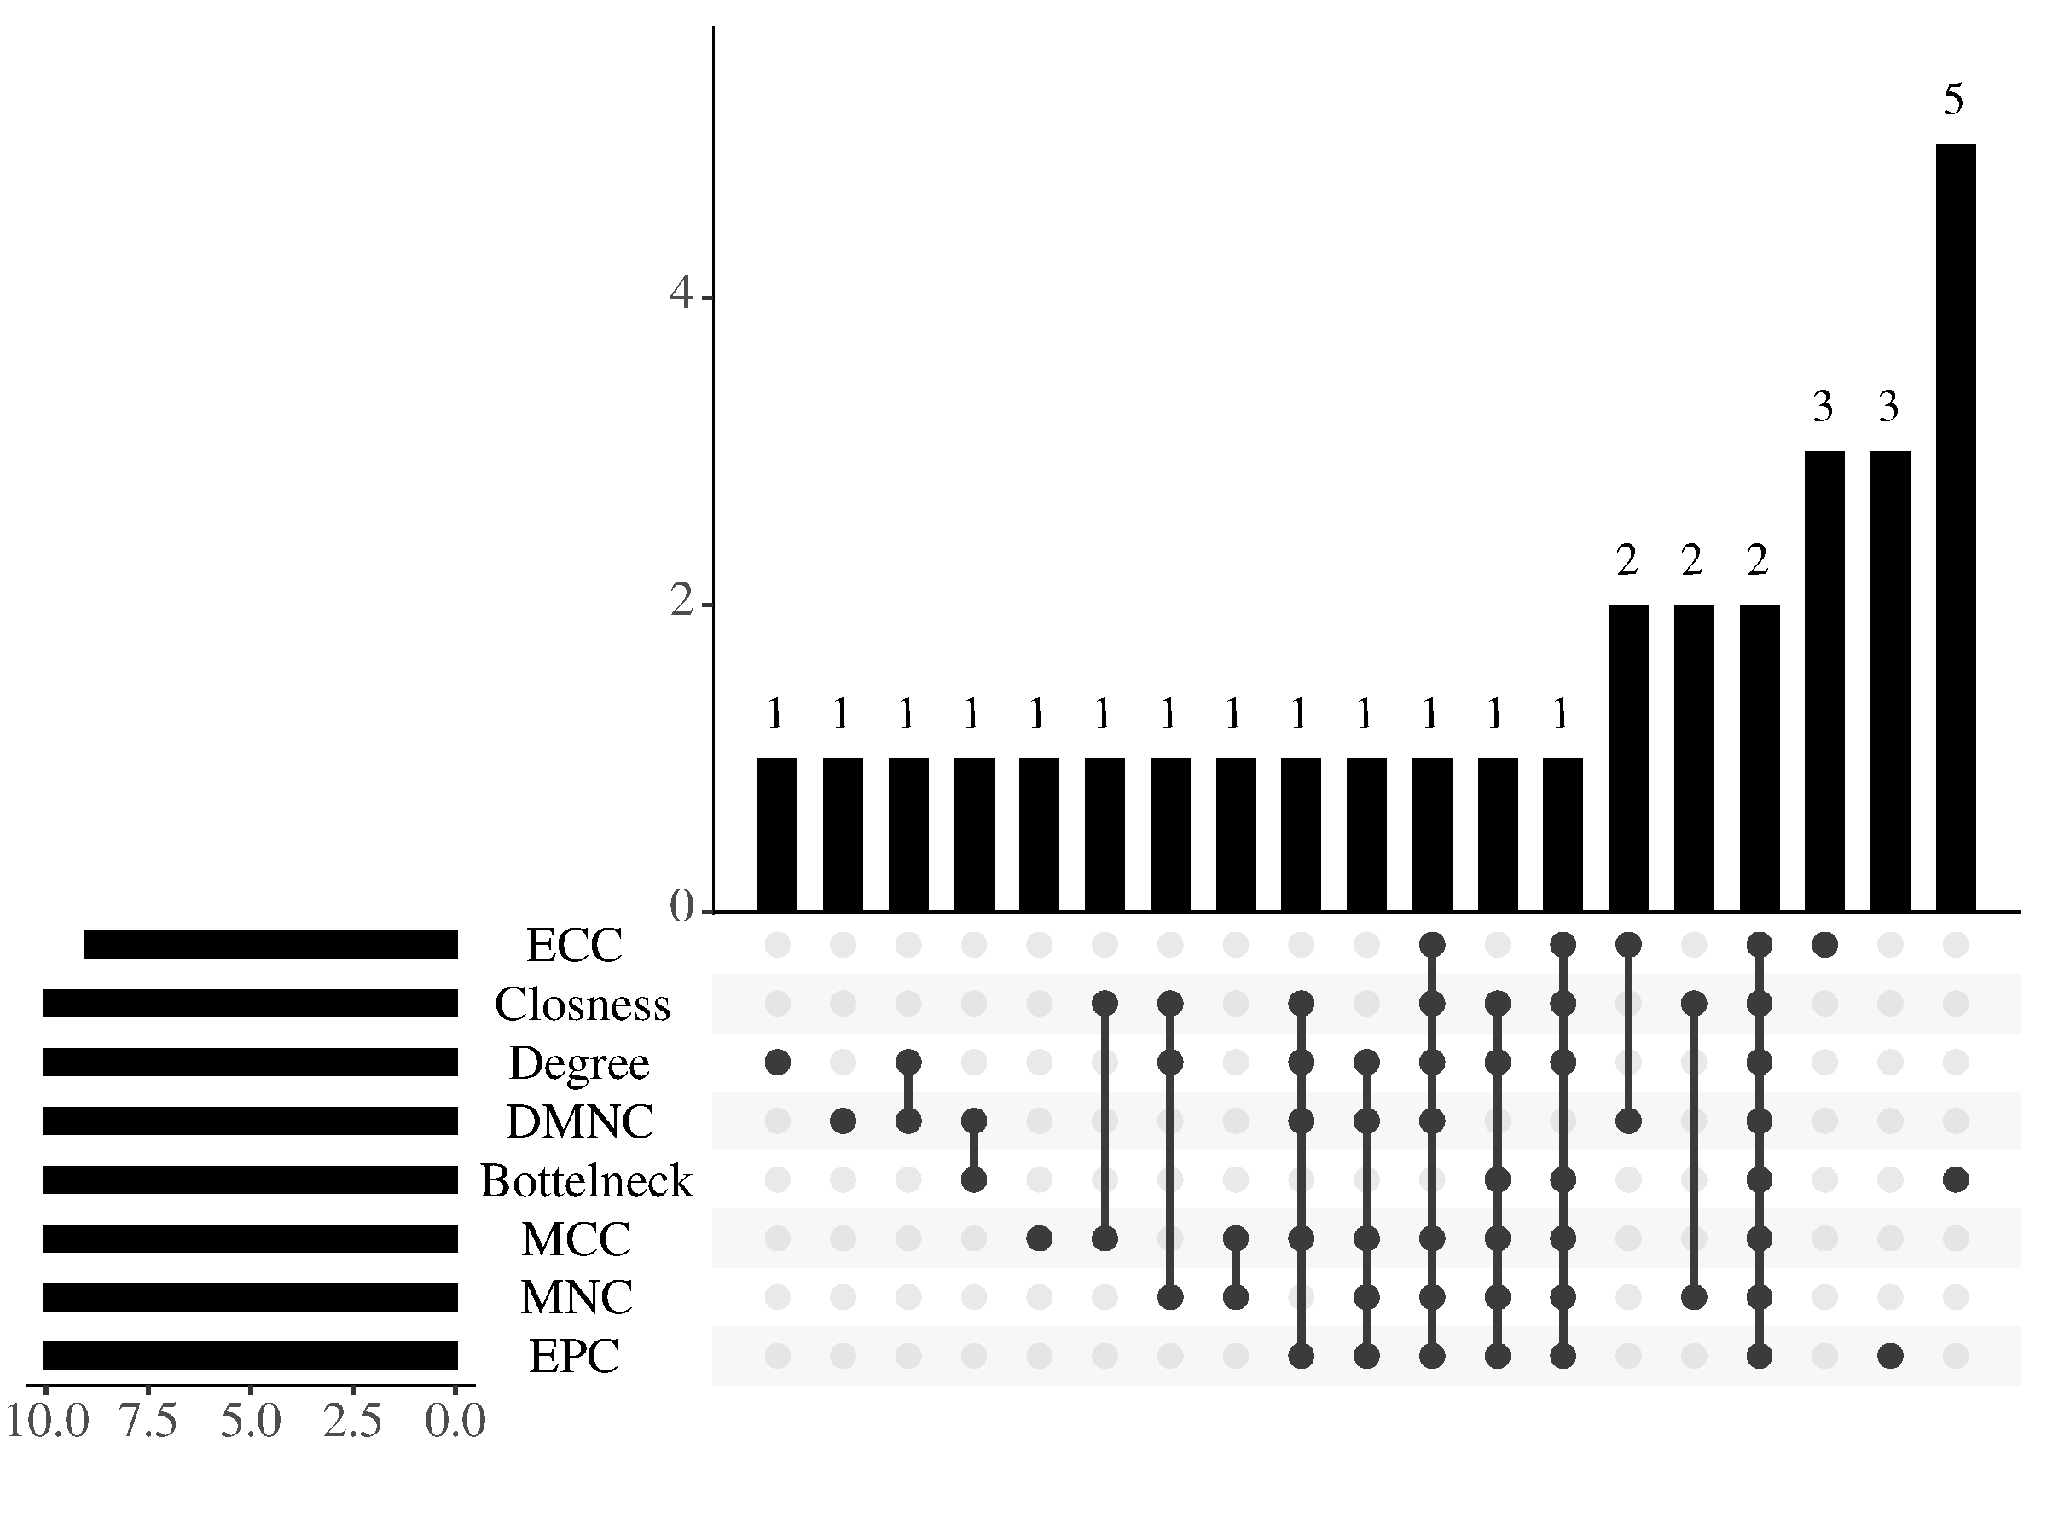
UpSet plot showing the overlap of hub genes identified by different algorithms.
Functional and Pathway Enrichment Analyses
Gene Ontology (GO) and Kyoto Encyclopedia of Genes and Genomes (KEGG) pathway enrichment analyses were performed on the 93 common DEGs to determine their biological functions. The GO analysis revealed significant enrichment in biological processes related to cell division and chromosome segregation. Specifically, the most significantly enriched BP terms included mitotic nuclear division, chromosome segregation, and cell cycle G2/M phase transition. For CC, the DEGs were predominantly localized to the condensed chromosome, centromeric region, and spindle. Key MF terms included microtubule binding and ATPase activity, with the results presented in Table 1. KEGG pathway analysis further corroborated these findings, indicating that the common DEGs were significantly enriched in four primary pathways, including the cell cycle, oocyte meiosis, cellular senescence, and viral carcinogenesis, as shown in Table 2. The cell cycle pathway demonstrated the highest level of enrichment, encompassing multiple hub genes (CDK1, CDC20, and CDCA8).
KEGG pathway analysis of differentially expressed genes (p-value < 0.05).
| Category | Term | Genes | Count |
|---|---|---|---|
| CC | nucleoplasm | 86% | 6 |
| CC | nucleus | 86% | 6 |
| CC | cytosol | 71% | 5 |
| BP | cell division | 57% | 4 |
| CC | spindle | 43% | 3 |
| CC | kinetochore | 43% | 3 |
| CC | midbody | 43% | 3 |
| CC | centrosome | 43% | 3 |
| BP | mitotic spindle assembly checkpoint signaling | 42% | 3 |
| BP | mitotic spindle assembly | 42% | 3 |
| BP | mitotic cell cycle | 42% | 3 |
| CC | chromosome, centromeric region | 29% | 2 |
| CC | spindle pole | 29% | 2 |
| BP | protein localization to kinetochore | 28% | 2 |
| BP | G2/M transition of mitotic cell cycle | 28% | 2 |
KEGG pathway analysis of differentially expressed genes.
| Category | ID | Term | p-value | Gene |
|---|---|---|---|---|
| hsa04218 | Cellular senescence | 0.001837012 | CDK1, MYBL2, FOXM1 | |
| hsa04110 | Cell cycle | 0.00186028 | CDC20, CDK1, TTK | |
| hsa04114 | Oocyte meiosis | 0.061438135 | CDC20, CDK1 | |
| hsa05203 | Viral carcinogenesis | 0.089597781 | CDC20, CDK1 |
Expression and Prognostic Significance of Hub Genes
The mRNA expression levels of the seven hub genes were analyzed using the GEPIA database, which incorporates data from the TCGA and GTEx projects. Consistent with the initial DEG analysis, all seven hub genes were significantly overexpressed in breast invasive carcinoma (BRCA) tumor tissues compared to normal breast tissues, and the results are shown in Figure 3A-G (p < 0.05). The most pronounced overexpression was observed for CDCA8 and CENPF, while TTK showed the most modest increase.
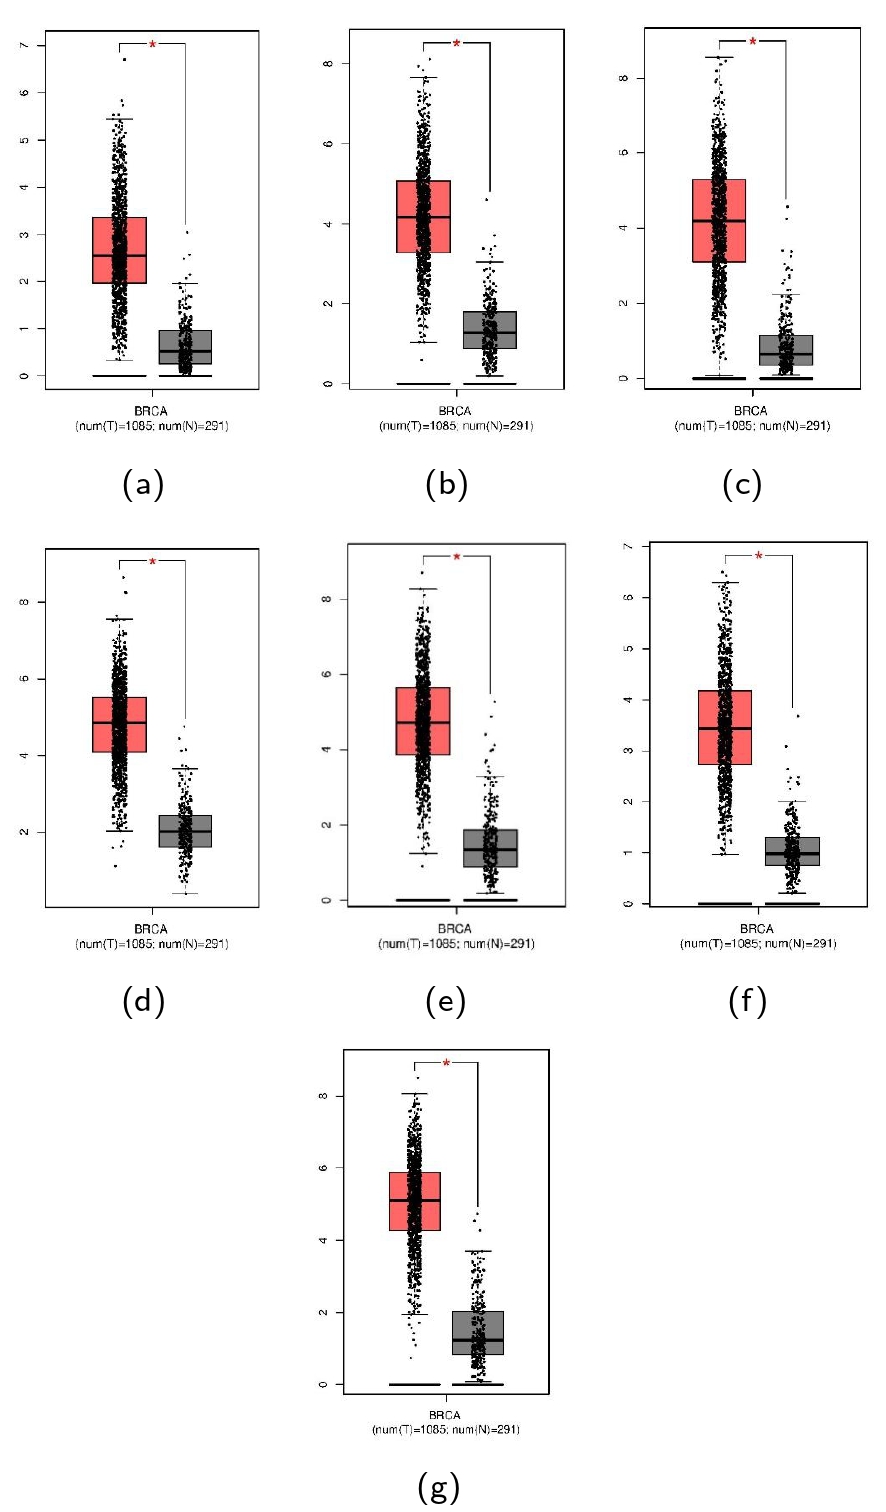
Expression of hub genes in BC patients and healthy individuals are shown in a box plot. (A) CDK1; (B) TTK; (C) CDC20; (D) CDCA8; (E) CENPF; (F) MYBL2; (G) FOXM1.
To evaluate their prognostic value, overall survival (OS) analysis was conducted using the Kaplan-Meier Plotter database. Initial unstratified analysis showed that high mRNA expression of CDCA8, MYBL2, and CENPF was significantly associated with poorer OS (Hazard Ratio [HR] > 1, log-rank p < 0.001). Conversely, high expression of CDC20, FOXM1, CDK1, and TTK genes showed a trend toward better OS (HR < 1, log-rank p < 0.05), which appeared paradoxical given their well-established oncogenic roles in promoting cell cycle progression.
To resolve this paradox and rigorously explore potential confounding by molecular heterogeneity, we performed stratified survival analysis based on PAM50 molecular subtypes (basal-like, HER2-enriched, luminal A, luminal B). This analysis revealed that the prognostic impact of these hub genes is highly context-dependent (Table 3, Figure 4A-G).
Summary of hub genes survival chart.
| Gene | HR | CI | p-value | Significance | Expression | Prognosis category |
|---|---|---|---|---|---|---|
| FOXM1 | 0.55 | (0.44–0.70) | 2.4e−07 | Very strong | High expression reduces risk by 0.55-fold | Good (HR < 1) |
| CDC20 | 0.75 | (0.60–0.94) | 0.013 | Significant | High expression reduces risk by 0.75-fold | Good (HR < 1) |
| TTK | 0.80 | (0.64–1.0) | 0.052 | Borderline | High expression reduces risk by 0.80-fold | Good (HR < 1) |
| CDK1 | 0.80 | (0.63–1.0) | 0.053 | Borderline | High expression reduces risk by 0.80-fold | Good (HR < 1) |
| CDCA8 | 1.85 | (1.47–2.33) | 8e−08 | Strong | High expression increases risk by 1.85-fold | Bad (HR > 1) |
| MYBL2 | 1.75 | (1.58–1.94) | 1e−16 | Very strong | High expression increases risk by 1.75-fold | Bad (HR > 1) |
| CENPF | 1.41 | (1.12–1.77) | 0.0037 | Significant | High expression increases risk by 1.41-fold | Bad (HR > 1) |
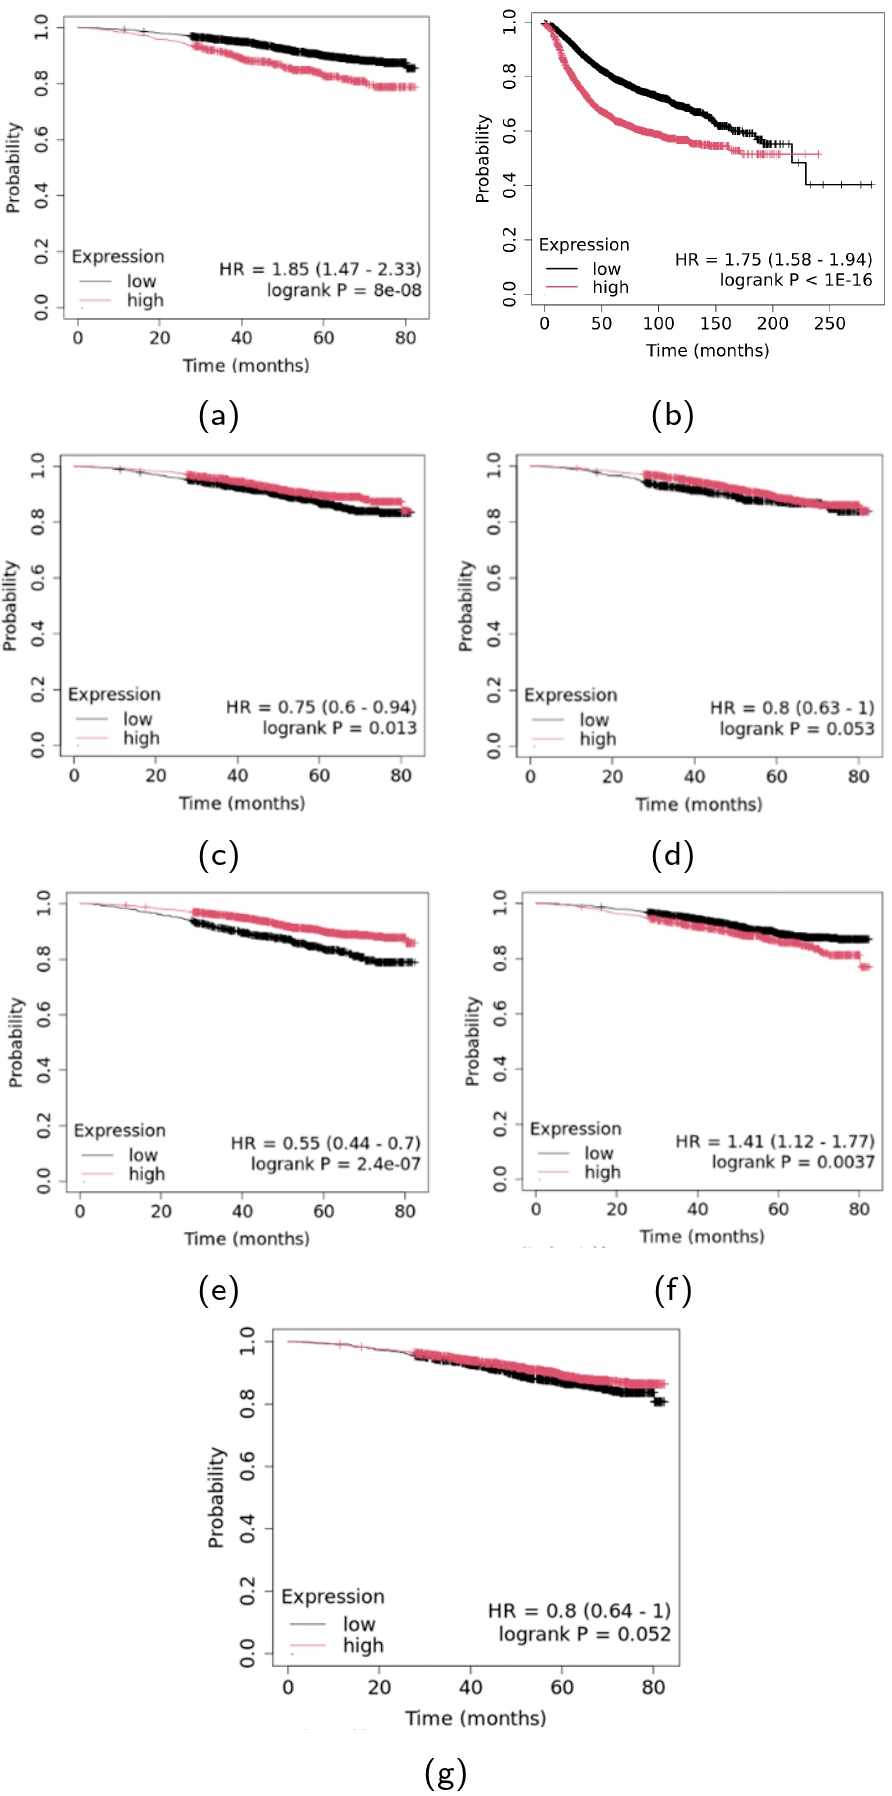
Survival analyses of hub genes. (A) CDCA8; (B) MYBL2; (C) CDC20; (D) CDK1; (E) FOXM1; (F) CENPF; (G) TTK.
Results from the subtype-stratified analysis:
-
FOXM1 : High expression was associated with poor prognosis in the HER2-enriched subtype (HR = 2.1, 95% CI: 0.98–4.44, p = 0.049), fully consistent with its known oncogenic role. No significant association was observed in other subtypes (basal-like: HR = 0.61, p = 0.08; luminal A: HR = 0.83, p = 0.35; luminal B: HR = 0.78, p = 0.28). -
TTK : High expression showed protective effects in luminal A (HR = 0.64, 95% CI: 0.44–0.94, p = 0.021) and luminal B (HR = 0.61, 95% CI: 0.38–0.97, p = 0.033) but no significant effect in basal-like (HR = 1.24, p = 0.39) or HER2-enriched (HR = 0.78, p = 0.42) subtypes. -
CDCA8 : Exhibited opposing effects across subtypes—protective in basal-like (HR = 0.57, 95% CI: 0.34–0.94, p = 0.027) but risk-associated in HER2-enriched (HR = 2.24, 95% CI: 1.27–3.96, p = 0.0044), luminal A (HR = 1.83, 95% CI: 1.24–2.71, p = 0.0021), and luminal B (HR = 1.71, 95% CI: 1.08–2.71, p = 0.021). -
MYBL2 : Showed the most striking dichotomy—risk-associated in basal-like (HR = 2.01, 95% CI: 1.02–3.93, p = 0.039) but strongly protective in luminal A (HR = 0.37, 95% CI: 0.23–0.59, p = 1.6e-5) and luminal B (HR = 0.25, 95% CI: 0.11–0.58, p = 0.00046). -
CDC20 andCENPF : Did not show statistically significant associations in any individual subtype after stratification (all p > 0.05), suggesting that their apparent protective or risk-associated effects in the unstratified analysis were likely driven by subtype composition bias rather than true prognostic signals. -
CDK1 : Showed protective effects only in luminal B (HR = 0.59, 95% CI: 0.36–0.97, p = 0.036), with no significant associations in other subtypes.
These results demonstrate that failing to account for molecular subtype heterogeneity can lead to misleading or even opposite prognostic associations. The paradoxical protective effects observed in the unstratified analysis (e.g., FOXM1, CDC20) were resolved by subtype stratification, revealing context-dependent risk associations that align with known biology. Further details are presented in Supplementary material S2.
Association with Clinicopathological Features
The relationship between hub gene expression and BC molecular subtypes was investigated using the UALCAN portal with TCGA data. All seven hub genes displayed significantly elevated expression in triple-negative breast cancer (TNBC) samples compared to other subtypes (Luminal A, Luminal B, HER2-enriched), as illustrated in Figure 5A-G (p < 0.05). This suggests a potential subtype-specific role for these genes, particularly in the more aggressive TNBC subgroup.
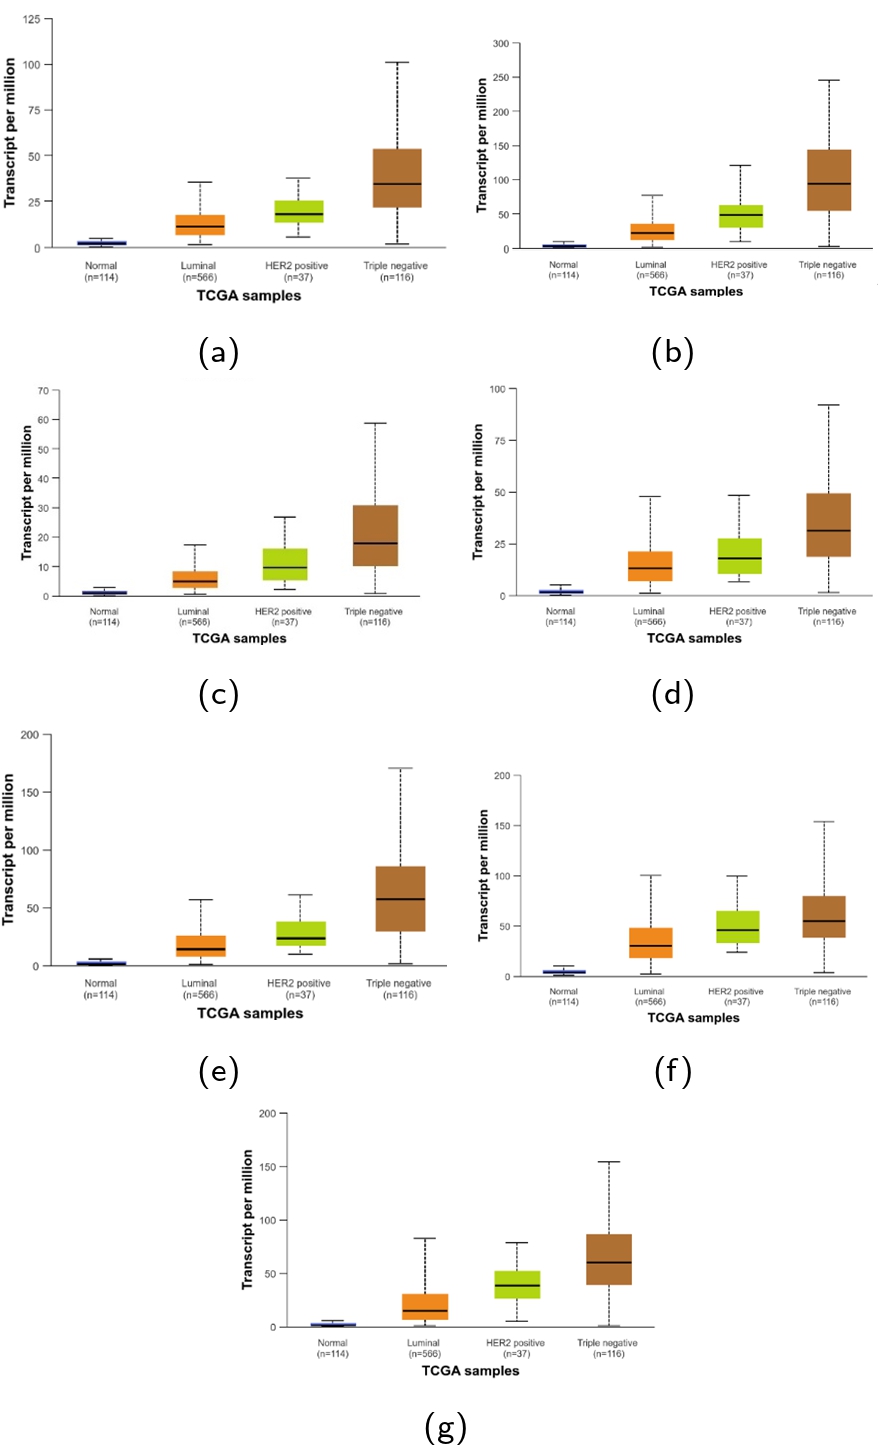
Relationships between hub genes expression and tumor subclasses: (A) CDCA8; (B) MYBL2; (C) CDC20; (D) CDK1; (E) FOXM1; (F) CENPF; (G) TTK.
miRNA-mRNA Regulatory Network
To investigate the post-transcriptional regulation of the hub genes, miRNA-mRNA interactions were analyzed using two authoritative databases, ENCORI and miRTargetLink 2.0, considering only interactions with strong experimental evidence. Analysis of these data revealed a complex regulatory landscape, which was visualized as an interaction network (Supplementary material S3). In total, 20 unique miRNAs were identified that simultaneously targeted three or more of the hub genes, as shown in Table 4. Among these, hsa-miR-29a-3p and hsa-miR-29b-3p emerged as key regulators, predicted to target five of the seven hub genes (MYBL2, CDK1, CDC20, CDCA8, and CENPF).
The respective 20 top miRNAs with strong validation targeting the hub genes.
| Gene | MiRNA |
|---|---|
| CDK1 | hsa-miR-24-3p, hsa-miR-302a-3p, hsa-miR-31-5p, hsa-miR-663a |
| TTK | hsa-miR-376a-3p, hsa-miR-376a-5p, hsa-miR-524-5p |
| MYBL2 | hsa-miR-149-3p, hsa-miR-30e-5p |
| FOXM1 | hsa-miR-134-5p, hsa-miR-149-5p, hsa-miR-194-5p, hsa-miR-204-5p, hsa-miR-216b-5p, hsa-miR-24-1-5p, hsa-miR-320a, hsa-miR-370-3p, hsa-miR-370-5p |
| CENPF | hsa-miR-148a-5p, hsa-miR-205-5p |
Prediction of Transcriptional Regulators
Two hub genes (FOXM1 and MYBL2) are transcription factors that may act as important regulators in BC patients. FOXM1 targets 13 genes (APOE, AR, BRIP1, BTG2, CCNB1, CDC25A, CDC25B, CDC6, CDH1, CDKN2A, CYP3A4, FGB, and KRT15), and MYBL2 targets 8 genes (CCNA1, CCND1, MYBL2, MYC, COL1A1, PSG1, NCL, and SP1). The transcription factors that may regulate the expression of these target genes were identified based on the TRRUST database (Supplementary Table S4). Furthermore, our analysis revealed that three other hub genes (CDK1, CDC20, and TTK), while not themselves transcription factors, are under strong regulation by upstream transcription factors, highlighting their pivotal position within the regulatory network.
Drug-Gene Interaction Analysis
Potential drug compounds were identified and ranked according to the highest aggregate interaction score provided by the DGIdb database. A screening for potential pharmacological interventions was performed using the DGIdb database. Among the seven hub genes, only CDK1 and TTK had documented interactions with known drugs or investigational compounds in the database, as shown in Table 5. For CDK1, 22 potential inhibitors were listed, including palbociclib and ribociclib (CDK4/6 inhibitors with known CDK1 affinity). For TTK (also known as MPS1), three investigational kinase inhibitors (BAY-1217389, CFI-402257, and MPS1-IN-1) were identified. No direct, high-confidence drug interactions were reported for the remaining five hub genes in the queried database.
Drug-gene interactions.
| Gene | Drug | Interaction Type & Directionality | Interaction Score |
|---|---|---|---|
| TTK | BAY-1161909 | Inhibitor | 20.61 |
| TTK | BAY-1217389 | Inhibitor | 20.61 |
| CDK1 | CHEMBL1082552 | N/A | 2.5 |
| CDK1 | ARUNCIN B | N/A | 2.58 |
| CDK1 | PROTUBOXEPINA | N/A | 1.29 |
| CDK1 | RIVICICLIB | Inhibitor | 0.86 |
| CDK1 | DINACICLIB | Inhibitor | 0.72 |
| TTK | HESPERADIN | Inhibitor | 0.52 |
| CDK1 | RG-547 | Inhibitor | 0.43 |
| CDK1 | CINNARIZINE | N/A | 0.37 |
| CDK1 | MILCICLIB | N/A | 0.32 |
| CDK1 | PATULIN | N/A | 0.29 |
| CDK1 | CHEMBL403183 | N/A | 0.26 |
| CDK1 | WITHAFERIN A | N/A | 0.21 |
| CDK1 | ROTENONE | N/A | 0.18 |
| CDK1 | CLOFIBRATE | N/A | 0.17 |
| CDK1 | SERTRALINE | N/A | 0.12 |
| CDK1 | (RS)ROSCOVITINE | N/A | 0.1 |
| CDK1 | FENOFIBRATE | N/A | 0.09 |
| CDK1 | CLOTRIMAZOLE | N/A | 0.08 |
| CDK1 | RONICICLIB | N/A | 0.06 |
| CDK1 | ALSTERPAULLONE | N/A | 0.05 |
| CDK1 | RUCAPARIB | N/A | 0.04 |
| CDK1 | SNS-314 | N/A | 0.03 |
| CDK1 | RG-1530 | N/A | 0.01 |
Discussion
Breast cancer remains a leading global health concern, with approximately 2.3 million new cases and significant mortality annually18. Early detection is paramount for effective management and improved survival outcomes19. Consequently, the identification of reliable molecular biomarkers for diagnosis, prognosis, and therapeutic targeting is a central focus in BC research20,21. This bioinformatics study aimed to identify and characterize key hub genes with potential biomarker utility in BC by integrating data from two independent GEO datasets.
Our integrated analysis identified 93 consistently expressed DEGs between BC and normal tissue across two datasets. From this pool, seven genes (MYBL2, FOXM1, CDK1, TTK, CDCA8, CDC20, and CENPF) emerged as central hubs within the protein-protein interaction network, indicating their pivotal roles in the underlying molecular circuitry of BC. While the selection of these seven genes as central hubs is consistent with previous network analyses22,23,24,25, our analysis extends these structural observations in several novel directions.
First, and most importantly, we demonstrated that the prognostic significance of these hub genes is not uniform but rather highly dependent on molecular subtype. Through systematic PAM50-stratified survival analysis, we resolved the apparent paradoxical protective effects (HR < 1 for known oncogenes) that appeared in the unstratified analysis. Specifically, FOXM1, which showed an overall protective signal, was actually associated with a significantly worse prognosis in the HER2-enriched subtype (HR = 2.1, p = 0.049), which is fully consistent with its established oncogenic role. This finding represents a classic example of Simpson's paradox, where an aggregate trend reverses when the population is appropriately stratified by a confounding variable (here, molecular subtype).
Second, we discovered that MYBL2 and CDCA8 exhibit striking opposing prognostic effects across subtypes. MYBL2, a well-known oncogene in aggressive BC23,26,27, was strongly risk-associated in basal-like tumors (HR = 2.01) but paradoxically strongly protective in luminal A (HR = 0.37) and luminal B (HR = 0.25). Similarly, CDCA8 was protective in basal-like (HR = 0.57) but risk-associated in HER2-enriched and luminal subtypes. These findings have profound implications: a gene's molecular function (e.g., promoting proliferation) may be constant, but its ultimate impact on patient survival can be inverted depending on the co-existing genetic landscape, likely due to differential interactions with subtype-specific transcription factor networks, hormone receptor signaling, or apoptotic pathways.
Third, CDC20 and CENPF, which showed significant HR signals in the unstratified analysis, lost all statistical significance upon subtype stratification. This suggests that their apparent prognostic associations were entirely driven by subtype composition bias rather than true biological effects.
Consistent with their central roles in BC, expression analysis via GEPIA confirmed significant upregulation of all seven hub genes in BC tissues compared to normal controls. MYBL2 is a well-established transcriptional regulator of cell cycle progression and survival, with its overexpression linked to metastasis and invasion in BC23,26,27. FOXM1, another transcription factor, is frequently overexpressed in various cancers, including BC, where it is associated with specific molecular subtypes and may represent a potential novel prognostic marker for male BC28,29,30. CDCA8 promotes tumor recurrence, leading to shorter relapse-free survival in BC and melanoma31,32, and its regulatory link with FOXM133 aligns with our TRRUST-based prediction of FOXM1 as a key transcription factor. CENPF is implicated in cell proliferation and metastasis34, while CDC20 acts as a key regulator of the cell cycle and serves as a biomarker for tumor prognosis and a therapeutic target. Several studies have identified CDC20 as a valuable prognostic factor and provided novel mechanistic insights linking its overexpression to altered immune landscapes35,36,37. CDK1 is a central kinase in cell cycle control and a promising therapeutic target38, and TTK (MPS1) is essential for chromosome segregation and acts as a favorable prognostic biomarker for TNBC survival39,40,41.
Functional enrichment analysis of the common DEGs strongly associated them with cell-cycle-related processes and pathways. GO terms were dominated by mitotic nuclear division and chromosome segregation, while KEGG analysis highlighted enrichment in the cell cycle, oocyte meiosis, cellular senescence, and viral carcinogenesis pathways. These findings are consistent with the known biology of the identified hub genes and align with previous studies implicating cell cycle dysregulation as a hallmark of BC42,43,44.
Our exploration of post-transcriptional regulation identified hsa-miR-29a-3p as a potential master regulator, targeting five of the seven hub genes. The documented role of miR-29a as a tumor suppressor in cancer, where its knockdown promotes cell growth45, supports its regulatory importance in this network. This regulatory importance is further cemented by its known mechanism of action in inducing apoptosis through the suppression of anti-death factors like Bcl-2 and Mcl-1 and the activation of pro-death regulators such as E2F1/346.
Clinically, all hub genes were significantly overexpressed in the TNBC subtype, suggesting a subtype-specific relevance that could inform targeted strategies for this aggressive form of BC. From a therapeutic perspective, drug-gene interaction analysis revealed that CDK1 and TTK are the most druggable hubs, with several known or investigational inhibitors listed in DGIdb (e.g., palbociclib for CDK1/4/6, BAY-1217389 for TTK). The lack of direct drug associations for the other hubs in current databases indicates an area for future drug discovery efforts.
There are several limitations to our study that should be acknowledged. First, the complete absence of experimental validation (qPCR, Western blotting, or functional cellular assays) means that the manuscript in its current form remains entirely computational. This limits the immediate translational impact of the findings. Second, the analysis relied on only two public microarray datasets with relatively small sample sizes (GSE231629, n=109; GSE3744, n=47), which may limit statistical power and generalizability. However, we deliberately reserved larger cohorts (TCGA, METABRIC) for independent validation, and our key survival findings were derived from the Kaplan-Meier Plotter which aggregates multiple datasets (total n > 4000). Third, while our subtype-stratified survival analysis resolved the paradoxical findings, the sample sizes within individual PAM50 subtypes were relatively small, particularly for the HER2-enriched and basal-like subgroups. This may have limited our ability to detect significant associations for some genes (e.g., CDC20, CENPF) that showed borderline or non-significant effects in subtype-specific analyses. Validation in larger, well-annotated subtype-specific cohorts is therefore essential. Fourth, the striking opposing effects observed for MYBL2 and CDCA8 across subtypes, while statistically robust, require mechanistic validation. The strong protective effect of MYBL2 in luminal subtypes (HR as low as 0.25) is unprecedented and warrants experimental investigation into potential subtype-specific interactions with hormone receptor signaling or apoptotic pathways. Fifth, the miRNA-mRNA and drug-gene interaction predictions were generated solely through computational databases and predictive algorithms. While these tools provide useful insights, their predictions require rigorous experimental confirmation through laboratory techniques such as luciferase reporter assays, qPCR, or drug-sensitivity experiments. Finally, we were unable to adjust for patient treatment history (e.g., chemotherapy, radiotherapy, hormone therapy) due to incomplete data in the public repositories used for survival analysis. While subtype stratification partially addresses this by capturing intrinsic biological heterogeneity, the potential confounding by treatment remains a limitation. We emphasize that the findings presented here are purely computational and hypothesis-generating; experimental validation in appropriate cell line models and animal studies is required before any clinical application.
Conclusions
In conclusion, we identified seven hub genes dysregulated in BC. Their prognostic significance is highly subtype-dependent. Subtype stratification resolved apparent paradoxes (e.g., FOXM1 is a risk factor only in HER2-enriched), and MYBL2 / CDCA8 showed opposing effects across subtypes. These hypothesis-generating findings require experimental validation in subtype-specific models before clinical translation.
Declarations
Abbreviations
BC: Breast cancer; BP: Biological Process; CC: Cellular Component; DEGs: Differentially expressed genes; ER: Estrogen receptor; GEO: Gene Expression Omnibus; GO: Gene Ontology; HER2: Human epidermal growth factor receptor 2; HR: Hazard Ratio; KEGG: Kyoto Encyclopedia of Genes and Genomes; MF: Molecular Function; OS: Overall survival; PAM50: Prediction of Analysis of Microarray 50 molecular subtype classifier; PPI: Protein-protein interaction; PR: Progesterone receptor; TFs: Transcription factors; TNBC: Triple-negative breast cancer; WGCNA: Weighted Gene Co-expression Network Analysis.
Acknowledgments
The paper has been extracted from Sedigheh Akhtartavan's PhD thesis supported by the Research Council of Semnan University of Medical Sciences (2083).
Author’s contributions
Not applicable.
Funding
This study was supported by the Research Council of Semnan University of Medical Sciences (Grant No. 2083).
Availability of data and materials
The original contributions presented in the study are included in the article/supplementary material. Further inquiries can be directed to the corresponding author.
Ethics approval and consent to participate
Not applicable.
Consent for publication
Not applicable.
Declaration of generative AI and AI-assisted technologies in the writing process
None.
Competing interests
The authors declare that they have no competing interests.