

Integrated evaluation of visceral adiposity indices and markers in adults with type 2 diabetes mellitus: A cross-sectional analytical study
- Department of Biomedical Sciences, College of Medicine, Gulf Medical University, Ajman, United Arab Emirates
- Department of Clinical Biochemistry, Thumbay Labs, Ajman, United Arab Emirates
- Department of Internal Medicine, Thumbay University Hospital, Ajman, United Arab Emirates
Abstract
Introduction: Visceral adiposity plays a pivotal role in the metabolic disturbances characteristic of type 2 diabetes mellitus (T2DM). Although body mass index (BMI) is widely used to estimate overall adiposity, it fails to differentiate between subcutaneous fat and metabolically active visceral fat. In contrast, the visceral adiposity index (VAI) integrates anthropometric and lipid parameters to estimate visceral fat mass, while adipokines such as leptin and adiponectin provide biochemical insights into visceral adipose tissue (VAT) activity. This study aimed to perform an integrated evaluation of BMI, VAI, and biochemical markers of VAT activity in patients with T2DM, and to determine their associations with glycaemic and lipid profiles.
Methods: This cross-sectional study included 90 adults (aged 30–60 years) diagnosed with T2DM. Participants were stratified into three groups based on BMI: normal weight (18.5–24.9 kg/m²), overweight (25.0–29.9 kg/m²), and obese (≥ 30.0 kg/m²). Clinical measurements included anthropometric data, blood pressure, fasting plasma glucose (FPG), postprandial blood glucose (PPBG), glycated haemoglobin (HbA1c), and comprehensive lipid profiles. Serum leptin and adiponectin levels were quantified via enzyme-linked immunosorbent assay (ELISA), and the VAI was calculated using a sex-specific formula. Statistical analyses were performed using analysis of variance (ANOVA), Pearson's correlation, and multivariate regression, with statistical significance defined as p < 0.05.
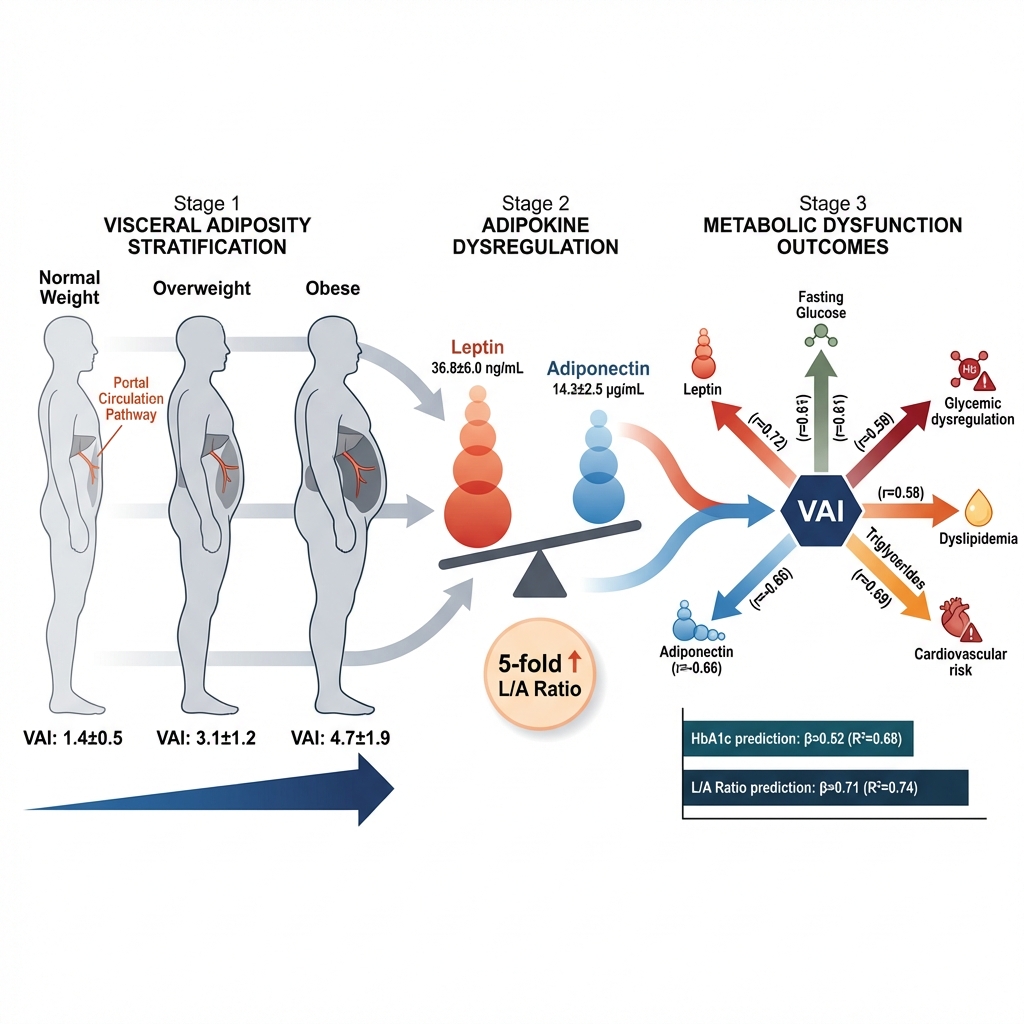
Results: BMI, waist circumference (WC), and VAI increased significantly across the groups (p < 0.001). The mean VAI values were 1.4 ± 0.5, 3.3 ± 1.2, and 4.7 ± 1.9 in the normal-weight, overweight, and obese cohorts, respectively. Serum leptin levels demonstrated a progressive increase (from 11.0 ± 3.1 to 36.8 ± 6.0 ng/mL), whereas adiponectin levels exhibited a concurrent decrease (from 14.3 ± 2.5 to 6.2 ± 1.9 µg/mL). The VAI demonstrated a strong positive correlation with leptin (r = 0.72) and a negative correlation with adiponectin (r = -0.66). Furthermore, an elevated VAI was significantly associated with increased levels of FPG, HbA1c, triglycerides (TG), and low-density lipoprotein cholesterol (LDL-C), as well as decreased levels of high-density lipoprotein cholesterol (HDL-C) (p < 0.001). Multivariate regression analysis identified the VAI as the strongest independent predictor of both HbA1c levels (β = 0.52) and the leptin-to-adiponectin ratio (β = 0.71).
Conclusion: The integration of anthropometric indices (BMI and VAI) with biochemical markers (leptin and adiponectin) facilitates a comprehensive evaluation of visceral adiposity and metabolic risk in patients with T2DM. Notably, the VAI exhibited stronger associations with glycaemic and lipid abnormalities than BMI alone, underscoring its clinical utility in assessing visceral fat dysfunction.
Introduction
Type 2 diabetes mellitus (T2DM) is a chronic metabolic disorder characterized by persistent hyperglycaemia resulting from defective insulin secretion, insulin resistance, or both. The global burden of T2DM continues to escalate in tandem with rising obesity rates, reflecting a shared pathophysiological link between adiposity and impaired glucose metabolism1. Adipose tissue functions as a metabolically active endocrine organ that regulates energy homeostasis and insulin sensitivity2. Among the body's adipose depots, visceral adipose tissue (VAT) contributes disproportionately to metabolic complications due to its proximity to the portal circulation and high lipolytic activity3.
VAT releases excess free fatty acids, proinflammatory cytokines, and adipokines that impair both hepatic and peripheral insulin sensitivity4. The metabolic impact of obesity is dictated not only by total fat mass but also by the distribution and functional state of the adipose tissue5. Consequently, assessing visceral adiposity has become essential for predicting insulin resistance and cardiometabolic risk.
Although body mass index (BMI) is widely utilized for obesity classification, it fails to differentiate between visceral and subcutaneous fat depots, thereby inadequately accounting for metabolic heterogeneity among individuals with similar BMI values6. To address this limitation, the visceral adiposity index (VAI) was developed to estimate visceral fat dysfunction utilizing routine clinical and biochemical parameters, including BMI, waist circumference (WC), triglycerides (TG), and high-density lipoprotein cholesterol (HDL-C)7. Multiple studies have validated the VAI as a reliable surrogate marker for insulin resistance and cardiometabolic risk across diverse populations8,9.
Population-based analyses confirm that elevated VAI is strongly associated with an increased risk of T2DM, metabolic syndrome, and cardiovascular disease10,11. Furthermore, the VAI has been linked to microvascular complications, such as diabetic nephropathy, in individuals with diabetes12. Thus, it provides a simple, robust method for quantifying visceral adiposity and predicting metabolic dysfunction beyond the capabilities of BMI alone.
In parallel with these clinical indices, adipokines serve as biochemical indicators of adipose tissue activity. Leptin, secreted in proportion to fat mass, regulates appetite and energy balance; however, chronic hyperleptinaemia leads to leptin resistance, contributing to persistent hunger and weight gain13,14. Conversely, adiponectin exerts insulin-sensitizing, anti-inflammatory, and anti-atherogenic effects, yet its circulating levels decrease inversely with visceral adiposity15,16. Therefore, the leptin-to-adiponectin ratio reflects adipose tissue dysfunction, with elevated ratios correlating with insulin resistance and poor metabolic control17,18.
Recent evidence underscores the necessity of an integrated evaluation combining anthropometric indices, lipid-based surrogates like the VAI, and adipokine biomarkers to comprehensively understand adiposity-related metabolic risk19,20.
Although BMI, the VAI, and individual adipokines have been independently evaluated regarding metabolic risk, studies integrating these anthropometric, lipid-based, and biochemical markers within a single T2DM cohort remain limited. Specifically, the relative prognostic value of the VAI versus BMI in predicting glycaemic dysregulation and adipokine imbalance has not been clearly established, particularly within Middle Eastern populations. Therefore, the present study was designed to provide an integrated evaluation of BMI, the VAI, and adipokine markers (leptin and adiponectin), and to determine their comparative associations with glycaemic and lipid abnormalities in adults with T2DM. This research addresses the current gap in integrated visceral adiposity assessment among Middle Eastern T2DM populations, where distinct genetic and lifestyle factors may uniquely modify adiposity-metabolic relationships.
Materials and Methods
Study Design and Participants
A cross-sectional analytical study was conducted involving 90 adults (aged 30–60 years) with established T2DM. Participants were recruited from the endocrinology outpatient clinics at Thumbay University Hospital (TUH) in Ajman, United Arab Emirates, and its collaborating clinics. The study protocol received ethical approval from the Institutional Review Board (IRB/COM/FAC/34/OCT-2022), and all participants provided written informed consent. Recruitment occurred between January 2023 and June 2024. Participants were equally stratified into three groups based on their BMI: normal weight (n = 30), overweight (n = 30), and obese (n = 30).
Inclusion Criteria
-
Adults aged 30–60 years diagnosed with T2DM according to the American Diabetes Association (ADA)
Standards of Medical Care in Diabetes—2024 21. -
Male and female participants undergoing lifestyle-based interventions, including dietary modifications and physical activity. Adherence to these interventions was qualitatively assessed via structured clinical interviews and medical record reviews. (Note: Standardized questionnaires, such as the International Physical Activity Questionnaire or food frequency scores, were not utilized, which may introduce residual confounding).
Exclusion Criteria
-
Diagnosis of type 1 diabetes, gestational diabetes, or secondary diabetes.
-
History or clinical presence of cardiovascular disease, nephropathy, hepatic dysfunction, or active infection.
-
Current use of antidiabetic or lipid-lowering pharmacological therapies at the time of recruitment.
Anthropometric and Clinical Measurements
Height, weight, and waist circumference (WC) were measured using standardized protocols. BMI was calculated as weight in kilograms divided by the square of height in meters (kg/m²). WC was measured at the midpoint between the lower margin of the last palpable rib and the top of the iliac crest. Blood pressure (BP) was recorded utilizing a digital sphygmomanometer; three measurements were taken following a 10-minute resting period, and the average value was recorded. Hypertension was defined as a systolic BP ≥ 130 mmHg and/or a diastolic BP ≥ 80 mmHg. Hypercholesterolaemia was defined as a total cholesterol level ≥ 5.2 mmol/L.
Biochemical Analysis
Venous blood samples were collected following a 10- to 12-hour overnight fast. Postprandial samples were drawn exactly 2 hours after a standardized meal. Fasting plasma glucose (FPG), postprandial blood glucose (PPBG), total cholesterol (TC), TG, HDL-C, and low-density lipoprotein cholesterol (LDL-C) were quantified using a Beckman Coulter AU680 analyser. Glycated haemoglobin (HbA1c) levels were measured via high-performance liquid chromatography (HPLC).
Serum adipokines were quantified using enzyme-linked immunosorbent assay (ELISA) kits for leptin (EQ 6444-9601) and adiponectin (EQ 6446-9601) sourced from Euroimmun (Germany). Leptin and adiponectin concentrations were expressed in ng/mL and µg/mL, respectively. The leptin-to-adiponectin ratio was calculated using these standardized units, consistent with prior literature. According to the manufacturer, the intra-assay and inter-assay coefficients of variation for both ELISA kits were < 8% and < 10%, respectively.
The VAI was calculated according to the sex-specific equation: VAI = [WC/(39.68 + (1.88 × BMI))] × (TG/1.03) × (1.31/HDL-C) for males and VAI = [WC/(36.58 + (1.89 × BMI))] × (TG/0.81) × (1.52/HDL-C) for females.
Statistical Analysis
Statistical analyses were performed using IBM SPSS Statistics, version 29.0. Data normality was evaluated using the Shapiro-Wilk test, and homogeneity of variance was assessed via Levene’s test. Although minor deviations from normality were detected in some variables based on the Shapiro-Wilk test, visual inspection of histograms and skewness-kurtosis values confirmed approximately normal distributions; consequently, continuous variables are reported as the mean ± standard deviation (SD). One-way analysis of variance (ANOVA) was utilized to compare continuous variables across the three independent BMI categories, followed by post hoc Bonferroni corrections for pairwise comparisons. Pearson’s correlation coefficients were calculated to evaluate associations among BMI, VAI, adipokines, and metabolic parameters.
Multiple linear regression analysis was conducted to identify independent predictors of HbA1c levels and the leptin-to-adiponectin ratio, entering all candidate variables simultaneously into the model. Multicollinearity was ruled out, as the variance inflation factor (VIF) for all variables remained < 2.5. Bootstrap resampling (1,000 iterations) was employed to validate the stability of the regression coefficients. Statistical significance was defined as p < 0.05. A post hoc power analysis was performed based on the observed effect size for the primary association between the VAI and HbA1c. Assuming an effect size (f²) of 0.35, an alpha level (α) of 0.05, and a total sample size of 90 participants, the achieved statistical power exceeded 90%, confirming the study was adequately powered to detect clinically meaningful associations.
Results
Anthropometric Measurements and Clinical Characteristics
Participants were equally distributed among the normal-weight, overweight, and obese groups. The mean age of the cohort was 49.6 ± 8.1 years, with a slight male predominance (52%). As shown in Table 1, the prevalence of hypertension and hypercholesterolaemia increased significantly in tandem with increasing BMI (p < 0.001). Mean weight, waist circumference (WC), and blood pressure values also increased significantly from the normal-weight to the obese categories. The mean BMI within the obese group was 33.5 ± 2.9 kg/m², indicating a predominance of class I obesity with limited overlap into class II. These findings demonstrate a clear progression of central obesity and cardiometabolic risk factors concomitant with increasing BMI.
Baseline Anthropometric Measurements and Clinical Characteristics of the Study Subjects
| Parameter | Total (n = 90) | Normal Weight (n = 30) | Overweight (n = 30) | Obesity (n = 30) | p value |
|---|---|---|---|---|---|
| Age (years) | 49.6 ± 8.1 | 48.2 ± 7.9 | 49.7 ± 8.3 | 50.9 ± 8.2 | 0.47 |
| Duration of Diabetes (years) | 6.4 ± 2.7 | 6.1 ± 2.5 | 6.5 ± 2.9 | 6.7 ± 2.8 | 0.61 |
| Hypertension (%) | 47 | 20 | 47 | 73 | < 0.001 |
| Hypercholesterolemia (%) | 53 | 33 | 57 | 70 | < 0.001 |
| Weight (kg) | 78.0 ± 7.7 | 70.8 ± 7.5 | 78.1 ± 8.0 | 84.6 ± 6.9 | < 0.001 |
| WC (cm) | 93.0 ± 5.4 | 86.5 ± 5.1 | 94.3 ± 5.2 | 99.1 ± 6.4 | < 0.001 |
| BMI (kg/m²) | 27.7 ± 2.5 | 22.3 ± 2.1 | 27.4 ± 2.5 | 33.5 ± 2.9 | < 0.001 |
| Systolic BP (mmHg) | 117 ± 7.6 | 109.6 ± 6.8 | 118.5 ± 8.2 | 126.3 ± 7.2 | < 0.001 |
| Diastolic BP (mmHg) | 81 ± 6.0 | 75.4 ± 5.9 | 81.1 ± 6.4 | 83.9 ± 6.1 | < 0.001 |
Visceral Adiposity Index and Adiposity Markers
As detailed in Table 2, visceral adiposity index (VAI) values increased progressively across the BMI categories, indicative of worsening visceral adipose tissue (VAT) dysfunction. Concurrently, serum leptin levels increased progressively, whereas adiponectin levels exhibited a significant decline across the groups. The VAI was positively correlated with leptin (r = 0.72, p < 0.001) and inversely correlated with adiponectin (r = -0.66, p < 0.001). Notably, the leptin-to-adiponectin ratio increased fivefold from the normal-weight to the obese cohorts, further reflecting progressive adipose tissue dysfunction. Furthermore, the VAI demonstrated a strong positive correlation with the leptin-to-adiponectin ratio (r = 0.74, p < 0.001).
Visceral Adiposity Index and Adipokine Markers Across BMI Groups
| Parameter | Normal Weight (n = 30) | Overweight (n = 30) | Obesity (n = 30) | p value |
|---|---|---|---|---|
| VAI | 1.4 ± 0.5 | 3.3 ± 1.2 | 4.7 ± 1.9 | < 0.001 |
| Leptin (ng/mL) | 11.0 ± 3.1 | 24.5 ± 5.9 | 36.8 ± 6.0 | < 0.001 |
| Adiponectin (µg/mL) | 14.3 ± 2.5 | 9.8 ± 2.8 | 6.2 ± 1.9 | < 0.001 |
| Leptin/adiponectin Ratio (ng/µg) | 0.77 ± 0.25 | 2.50 ± 0.61 | 3.88 ± 0.92 | < 0.001 |
Metabolic Variables
Glycaemic and lipid profiles deteriorated with increasing adiposity, characterized by significant elevations in fasting plasma glucose (FPG), postprandial blood glucose (PPBG), glycated haemoglobin (HbA1c), triglycerides (TG), and low-density lipoprotein cholesterol (LDL-C), alongside a significant reduction in high-density lipoprotein cholesterol (HDL-C). The VAI exhibited strong positive correlations with FPG (r = 0.61), HbA1c (r = 0.58), TG (r = 0.69), and LDL-C (r = 0.55), as well as an inverse correlation with HDL-C (r = -0.48) (all p < 0.001). These associations underscore that visceral fat dysfunction exerts a more profound impact on metabolic parameters than overall adiposity alone.
Integrated Regression Analysis
All covariates were entered simultaneously into a single multivariable regression model, which accounted for 68% of the variance in HbA1c levels (R² = 0.68) and 74% of the variance in the leptin-to-adiponectin ratio (R² = 0.74). The VAI emerged as the most significant independent predictor for both outcomes, demonstrating that visceral adiposity is more strongly associated with metabolic dysregulation in T2DM than total adiposity. Collinearity diagnostics revealed acceptable variance inflation factor (VIF) values for all predictors (range: 1.12–2.34), indicating an absence of significant multicollinearity among the independent variables. Finally, bootstrap resampling (1,000 iterations) yielded regression coefficients and confidence intervals comparable to those of the original model, confirming the robustness and stability of the observed associations.
Discussion
The present study evaluated the interrelationships among body mass index (BMI), the visceral adiposity index (VAI), and biochemical markers of visceral adipose tissue activity—specifically leptin and adiponectin—in adults with T2DM. The findings demonstrated that, compared with BMI alone, the VAI and adipokine parameters exhibited stronger and more consistent associations with glycaemic control, lipid metabolism, and blood pressure. These results indicate that visceral fat distribution and function play a more critical role in determining metabolic risk than total body adiposity.
In this cohort, both BMI and waist circumference (WC) increased progressively across the weight categories; however, the elevation in the VAI was considerably more pronounced. The VAI was strongly positively correlated with fasting plasma glucose (FPG), glycated haemoglobin (HbA1c), and triglycerides (TG), and inversely correlated with high-density lipoprotein cholesterol (HDL-C). Multiple regression analysis confirmed that the VAI was the most significant independent predictor of both HbA1c levels and the leptin-to-adiponectin ratio. The leptin-to-adiponectin ratio was examined specifically in relation to the VAI because both represent complementary measures of visceral adipose tissue (VAT) dysfunction, whereas other predictors, such as BMI and age, primarily reflect general adiposity or demographic factors. Restricting the model in this manner improved interpretability and minimized redundancy. Ultimately, these findings suggest that visceral adiposity, rather than overall fat mass, is the primary driver of insulin resistance and glycaemic dysregulation in individuals with T2DM.
Several large-scale studies have corroborated that elevated VAI values are significantly associated with the development of T2DM, metabolic syndrome, and cardiovascular complications. A 2024 meta-analysis reported that the VAI is a reliable and independent predictor of T2DM across diverse populations22. Another investigation among adults in the United States demonstrated a dose-dependent relationship—wherein progressively increasing VAI values correspond to worsening metabolic risk—between the VAI and the incidence of diabetes, even after adjusting for BMI and other metabolic confounders23. Furthermore, findings from the National Health and Nutrition Examination Survey (NHANES) indicated that individuals with higher VAI values faced an increased risk of coronary heart disease and higher all-cause mortality, affirming the prognostic importance of this index24 . A prospective study involving individuals with hypertension further demonstrated that a progressive rise in the VAI predicted new-onset diabetes and impaired FPG, even among participants with comparable BMIs, highlighting the superior discriminatory power of the VAI for assessing metabolic risk25.
The progressive increase in the VAI observed in the current study and its significant association with dyslipidaemia and hyperglycaemia align closely with previous findings. These relationships reinforce that the VAI incorporates both anthropometric and biochemical dimensions of adiposity, thereby capturing the functional aspects of visceral fat activity that cannot be represented by BMI alone26,27,28.
The present study also demonstrated a significant increase in leptin concentrations and a concomitant decrease in adiponectin concentrations in parallel with increasing VAI and BMI. The resulting escalation in the leptin-to-adiponectin ratio across weight categories reflects a shift toward adipose tissue dysfunction, characterized by insulin resistance and inflammation. The inverse association between the VAI and adiponectin levels observed in this cohort is consistent with the role of adiponectin as an insulin-sensitizing and anti-inflammatory adipokine. Conversely, elevated leptin levels are known to promote sympathetic overactivity and vascular stiffness, contributing to the broader cardiometabolic burden observed in obesity-related diabetes.
Previous studies have established that the leptin-to-adiponectin ratio is a highly sensitive indicator of adipose tissue dysfunction and metabolic risk. A 2024 study demonstrated that this ratio positively correlated with insulin resistance and key markers of metabolic syndrome29. Another investigation indicated that a profound adiponectin-to-leptin imbalance reflected a greater inflammatory burden and was strongly associated with mortality risk in metabolic diseases30. The findings of the current study corroborate these observations by demonstrating a fivefold increase in the leptin-to-adiponectin ratio between normal-weight and obese participants with T2DM, suggesting that this ratio could serve as a practical indicator of metabolic dysfunction in clinical settings.
Lifestyle and therapeutic interventions that reduce body weight and visceral fat have been shown to significantly improve the leptin-to-adiponectin ratio. For instance, a controlled dietary intervention utilizing a low-energy diet decreased leptin levels and increased adiponectin levels, ultimately enhancing insulin sensitivity31. Similarly, a combined exercise and dietary programme in older adults resulted in significant improvements in the adiponectin-to-leptin ratio alongside increased insulin sensitivity32,33. Collectively, these findings underscore the clinical importance of targeting adipose dysfunction, rather than focusing solely on weight reduction, in the management of metabolic disorders.
The mechanistic link among visceral adiposity, adipokine imbalance, and cardiometabolic dysfunction in patients with T2DM is illustrated in Figure 1.
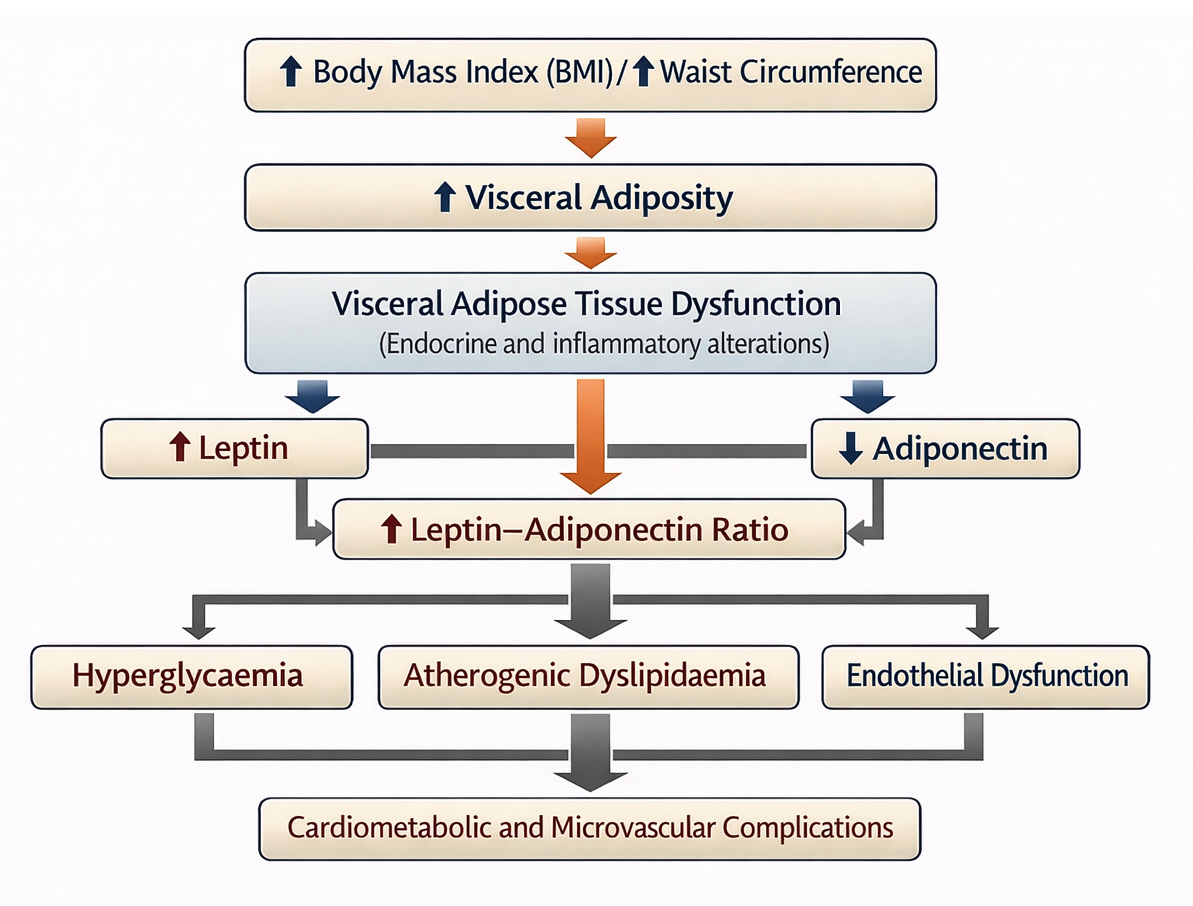
Mechanistic link between visceral adiposity, adipokine imbalance and cardiometabolic dysfunction in patients with T2DM. Increased BMI and WC promote increased visceral adiposity, leading to visceral adipose tissue dysfunction. Dysfunctional visceral fat exhibits altered adipokine secretion, characterised by increased leptin levels and decreased adiponectin levels, resulting in an increased leptin-adiponectin ratio. This adipokine imbalance contributes to insulin resistance and systemic inflammation, which in turn is strongly associated with hyperglycaemia, atherogenic dyslipidaemia and endothelial dysfunction. These interrelated processes collectively increase the risk of cardiometabolic and microvascular complications in individuals with T2DM.
Glycaemic and Lipid Profile Variables across BMI Groups
| Parameter | Normal Weight (n = 30) | Overweight (n = 30) | Obesity (n = 30) | p value |
|---|---|---|---|---|
| FPG (mmol/L) | 7.9 ± 1.0 | 9.6 ± 1.1 | 11.8 ± 1.3 | < 0.001 |
| PPBG (mmol/L) | 10.8 ± 1.6 | 13.4 ± 1.9 | 15.7 ± 2.0 | < 0.001 |
| HbA1c (%) | 6.9 ± 0.4 | 7.9 ± 0.6 | 8.7 ± 0.5 | < 0.001 |
| TC (mmol/L) | 5.0 ± 0.6 | 5.7 ± 0.5 | 6.1 ± 0.7 | < 0.001 |
| TG (mmol/L) | 1.6 ± 0.4 | 2.4 ± 0.6 | 2.9 ± 0.5 | < 0.001 |
| HDL-C (mmol/L) | 1.5 ± 0.3 | 1.3 ± 0.3 | 1.2 ± 0.2 | 0.01 |
| LDL-C (mmol/L) | 3.1 ± 0.5 | 4.0 ± 0.6 | 4.5 ± 0.5 | < 0.001 |
| TC/HDL-C Ratio | 3.3 ± 0.7 | 4.6 ± 0.9 | 5.2 ± 1.0 | < 0.001 |
Multiple Linear Regression Analysis for Predictors of Glycaemic and Adipokine Dysregulation
| Predictors of HbA1c (R² = 0.68) | ||||||
|---|---|---|---|---|---|---|
| Predictor | β | SE | t | p value | 95% CI | VIF |
| VAI | 0.52 | 0.09 | 5.84 | <0.001 | 0.34 - 0.70 | 1.94 |
| Leptin | 0.44 | 0.08 | 5.23 | <0.001 | 0.28 - 0.60 | 2.34 |
| Adiponectin | -0.38 | 0.09 | -4.27 | <0.01 | -0.56 - 0.20 | 2.11 |
| BMI | 0.29 | 0.14 | 2.04 | 0.04 | 0.02 - 0.56 | 1.76 |
| Age | 0.12 | 0.09 | 1.35 | 0.19 | -0.06 - 0.30 | 1.12 |
| Predictors of Leptin/Adiponectin Ratio (R² = 0.74) | ||||||
| Predictor | β | SE | t | p value | 95% CI | VIF |
| VAI | 0.71 | 0.10 | 7.02 | <0.001 | 0.51 - 0.91 | 1.88 |
| BMI | 0.33 | 0.10 | 3.41 | <0.01 | 0.13 - 0.53 | 1.92 |
| Age | 0.09 | 0.08 | 1.08 | 0.28 | -0.07 - 0.25 | 1.15 |
The strong correlation observed between the VAI and adipokine imbalance in the present study points to a shared underlying pathophysiological process driven by inflammation and endocrine dysregulation within the visceral fat compartment. Adipose tissue functions as an active immunometabolic organ that secretes various inflammatory mediators. This includes the interleukin-1 receptor antagonist (IL-1RA), which is typically elevated in obesity and T2DM but decreases following bariatric surgery-induced weight loss34. The reduction in IL-1RA following the loss of fat mass highlights the reversible nature of visceral adipose inflammation. Furthermore, recent mechanistic reviews detailing adipose tissue dysfunction have elucidated how chronic hypoxia, macrophage infiltration, and oxidative stress within visceral fat depots collectively propagate systemic insulin resistance35.
Therefore, the significant associations of both the VAI and the leptin-to-adiponectin ratio with glycaemic and lipid parameters in this study likely reflect the combined endocrine and inflammatory activity of visceral adipose tissue. These findings suggest that the VAI, by incorporating triglyceride and HDL-C levels, serves as a reliable surrogate for evaluating both the quantity and quality of visceral fat, whereas the leptin-to-adiponectin ratio provides a direct biochemical representation of adipose tissue health.
Additionally, the present study demonstrated that a higher VAI was associated with increased levels of TC, TG, and LDL-C, and decreased levels of HDL-C. These outcomes align with previous work reporting that individuals with elevated VAI values face a significantly increased risk of atherogenic dyslipidaemia and cardiovascular disease36. Another investigation assessing novel adiposity indices—such as the lipid accumulation product and the triglyceride-glucose index—concluded that these markers, alongside the VAI, were superior to BMI in predicting cardiovascular disease risk37. Furthermore, dietary patterns have been shown to modify the relationship between the VAI and cardiovascular outcomes, indicating that nutritional behaviour and visceral fat act synergistically to influence cardiometabolic health38.
The specific pattern of dyslipidaemia observed in the current study suggests that excess visceral fat increases the hepatic delivery of free fatty acids, thereby stimulating the overproduction of very-low-density lipoproteins and impairing HDL-C synthesis. This underlying mechanism explains why the VAI, which intrinsically incorporates TG and HDL-C into its formula, functions effectively as an integrated marker of both dyslipidaemia and broader metabolic disturbance.
The present data also support an association between visceral adiposity and microvascular complications in individuals with diabetes. Participants in the highest VAI tertile exhibited significantly higher HbA1c, FPG, and LDL-C levels. These patterns are consistent with prior findings demonstrating an independent association between the VAI and the presence and severity of diabetic kidney disease (DKD)39. The proposed mechanism involves lipid accumulation and endothelial inflammation within the renal microvasculature, which collectively accelerate glomerular injury and proteinuria. Thus, monitoring the VAI could aid in the early detection of microvascular risk among patients with T2DM.
Although the present study was cross-sectional, the observed trends mirror those described in longitudinal research. A 2024 cohort investigation reported that individuals with an elevated VAI and more severe adipose tissue dysfunction were more likely to progress from prediabetes to overt diabetes, and less likely to revert to normoglycaemia40. This supports the hypothesis that early visceral adipose dysfunction plays a pivotal role in the transition from compensated insulin resistance to clinical diabetes. The strong associations between the VAI and glycaemic parameters observed in the present analysis suggest that this index may serve as a valuable predictive tool for identifying patients at high risk of glycaemic deterioration.
The combined assessment of BMI, the VAI, and adipokines provides a multidimensional approach to understanding adiposity-related metabolic risk. In clinical settings, the VAI can be easily calculated using routinely available variables—such as BMI, WC, TG, and HDL-C—without the need for advanced imaging modalities. When utilized in conjunction with adipokine markers, the VAI facilitates the identification of patients with metabolically unhealthy obesity (defined as obesity associated with insulin resistance, dyslipidaemia, impaired glycaemic control, and adipokine imbalance) who might otherwise remain unrecognized using BMI alone.
Recent evidence also indicates that the VAI correlates with future cardiovascular and renal events in individuals with T2DM, emphasizing its value as a prognostic marker beyond mere glucose control26. Therefore, integrating the VAI into risk assessment algorithms could refine the prediction of cardiometabolic complications. Emerging artificial intelligence models for cardiovascular risk prediction have demonstrated improved accuracy when adiposity and metabolic indices are incorporated, further highlighting the potential of the VAI in precision diabetes care41.
The primary strength of this study lies in its integrated design, which simultaneously evaluates anthropometric, biochemical, and functional measures of adiposity within a single cohort. The inclusion of both leptin and adiponectin as markers of visceral adipose activity provides mechanistic support for the observed associations between the VAI and metabolic parameters.
However, the cross-sectional design of this study precludes causal inference and prevents the determination of temporal or directional relationships between visceral adiposity and metabolic deterioration. Furthermore, sex was not included as a covariate in the primary regression models due to the comparable distribution of males and females across BMI categories, as well as the absence of significant sex-related interaction effects on HbA1c or the leptin-to-adiponectin ratio during preliminary analyses. Nonetheless, residual confounding related to sex-specific biological or behavioural factors cannot be entirely excluded.
Furthermore, the exclusion of patients receiving pharmacological therapy, the small sample size, and the single-centre study setting may limit the generalizability of these findings. The exclusion of participants receiving antidiabetic or lipid-lowering medications was a deliberate design choice intended to minimize pharmacological confounding, thereby allowing for a clearer evaluation of the physiological relationships among visceral adiposity, adipokines, and metabolic parameters. Although this approach enhances internal validity, it may restrict the generalizability of the findings to broader patient populations receiving standard pharmacotherapy. Additionally, the single-centre nature of the study may limit its external validity. Future multicentre studies utilizing independent validation cohorts are warranted to confirm these findings across more diverse clinical settings.
A methodological limitation of the present study is that the VAI is a surrogate marker rather than a direct measure of visceral adipose tissue. Gold-standard imaging techniques, such as computed tomography (CT) or magnetic resonance imaging (MRI), which provide precise quantification of visceral fat area, were not feasible for validating the VAI within this specific cohort. Nevertheless, the VAI has been previously validated against MRI-measured visceral fat and demonstrated to correlate strongly with visceral adipose tissue dysfunction and cardiometabolic risk7. While the VAI remains a practical and clinically feasible index, future studies incorporating imaging-based validation within similar ethnic populations would further strengthen its applicability. Furthermore, unmeasured confounders—such as ethnicity-specific genetic predispositions, dietary patterns, and cultural lifestyle habits prevalent within the UAE population—may have influenced visceral fat distribution and adipokine profiles. Finally, although mild deviations from normality were observed for certain variables, parametric tests were retained due to their statistical robustness at this sample size; however, future research may benefit from sensitivity analyses utilizing nonparametric or robust regression approaches.
Future investigations should employ longitudinal and interventional designs to determine whether reductions in the VAI or the normalization of the leptin-to-adiponectin ratio directly result in improved glycaemic control, lipid profiles, and cardiovascular outcomes. It would also be clinically valuable to assess whether incorporating the VAI into established cardiovascular and renal risk equations enhances predictive accuracy and clinical decision-making in diabetes management. Ultimately, future research should encompass longitudinal cohorts to track temporal changes in the VAI alongside incident complications, and involve more heterogeneous patient populations, including individuals receiving standard pharmacological treatments.
Conclusion
This study highlights that, compared with BMI, visceral adipose dysfunction—quantified by the VAI and the leptin-to-adiponectin ratio—is more closely associated with glycaemic and lipid abnormalities in adults with T2DM. The progressive increase in the VAI and leptin levels, coupled with a concomitant decrease in adiponectin levels, reflects worsening adipose tissue inflammation and endocrine imbalance. These findings emphasize the importance of evaluating visceral fat quality, rather than solely its quantity, in the clinical management of diabetes. Integrating the VAI and adipokine profiles into routine assessments could improve early risk detection and guide targeted interventions aimed at reducing visceral adiposity, ultimately achieving better metabolic and cardiovascular outcomes.
Abbreviations
ADA: American Diabetes Association; ANOVA: Analysis of Variance; BMI: Body Mass Index; BP: Blood Pressure; CT: Computed Tomography; DKD: Diabetic Kidney Disease; ELISA: Enzyme-Linked Immunosorbent Assay; FPG: Fasting Plasma Glucose; HbA1c: Glycated Haemoglobin; HDL-C: High-Density Lipoprotein Cholesterol; HPLC: High-Performance Liquid Chromatography; IL-1RA: Interleukin-1 Receptor Antagonist; IRB: Institutional Review Board; LDL-C: Low-Density Lipoprotein Cholesterol; MRI: Magnetic Resonance Imaging; PPBG: Postprandial Blood Glucose; SD: Standard Deviation; SPSS: Statistical Package for the Social Sciences; TC: Total Cholesterol; TG: Triglycerides; T2DM: Type 2 Diabetes Mellitus; TUH: Thumbay University Hospital; VAI: Visceral Adiposity Index; VAT: Visceral Adipose Tissue; VIF: Variance Inflation Factor; WC: Waist Circumference.
Acknowledgments
The authors gratefully acknowledge the staff of Thumbay Labs for their valuable assistance in sample processing and technical support throughout the study.
Author’s contributions
AS: Conceptualization, study design, data analysis, manuscript drafting and final approval; SA: Sample collection, quality control and laboratory analysis; MJ: Clinical supervision and patient recruitment. All authors read and approved the final manuscript.
Funding
None.
Availability of data and materials
The anonymized dataset generated during this study is available from the corresponding author upon reasonable request.
Ethics approval and consent to participate
This study was reviewed and approved by the Institutional Review Board, Gulf Medical University, Ajman, United Arab Emirates (Approval No. IRB/COM/FAC/34/OCT-2022). All study procedures were conducted in accordance with the ethical standards of the institutional and national research committee and with the 1964 Helsinki Declaration and its later amendments.
Consent for publication
Written informed consent was obtained from all participants prior to inclusion in the study. Participants were informed about the study objectives, procedures, potential risks and their right to withdraw at any time without penalty.
Declaration of generative AI and AI-assisted technologies in the writing process
The authors declare that they have not used generative AI (a type of artificial intelligence technology that can produce various types of content including text, imagery, audio and synthetic data).
Competing interests
The authors declare that they have no competing interests.