

Relationships of Serum Osteocalcin, 25-Hydroxyvitamin D, and Parathyroid Hormone with Glycaemic and Lipid Indices in Type 2 Diabetes Mellitus
- Department Pharmacology (Clinical Pharmacology Unit), Sri Aurobindo Medical College & PG Institute, Sri Aurobindo University, Indore, India-453555
- Department of Biochemistry, Jaipur National University, Institute for Medical Sciences and research Centre, Jaipur, Rajasthan. India-302017
- Department of Medical Biochemistry, Index medical college, Hospital & Research Centre, Malwanchal University Indore (M.P.) India-452016
- Department of Medical Biochemistry, Index medical college, Malwanchal University Indore (M.P.) India-452016 Hospital & Research Centre, Indore (M.P.) India-452016
- Department Pharmacology, Sri Aurobindo Medical College & PG Institute, Sri Aurobindo University, Indore, India-453555
Abstract
Introduction: Type 2 diabetes mellitus (T2DM) is a multifactorial metabolic disorder characterized by chronic hyperglycemia and is frequently associated with dysregulated bone and mineral metabolism. Emerging evidence suggests a complex interplay between osteocalcin, vitamin D, and parathyroid hormone (PTH) in the regulation of glucose and lipid homeostasis. Design: This investigation employed a cross-sectional study design. Methods: A cross-sectional study was conducted involving 200 participants: 100 patients with T2DM and 100 age- and sex-matched healthy controls. Fasting blood glucose (FBS), postprandial blood glucose (PPBS), HbA1c, lipid profile, serum osteocalcin, vitamin D3, and PTH were measured using standardized biochemical assays. Participants were stratified according to PTH, vitamin D3, and osteocalcin levels, and correlations with glycemic and lipid indices were analyzed. Results: T2DM patients with elevated PTH (>65 pg/mL) showed significantly higher FBS and HbA1c levels as well as lower vitamin D3 concentrations compared with those with normal PTH (p < 0.05). Stratification by vitamin D3 revealed higher PTH levels in vitamin-D-deficient individuals (<20 ng/mL), while osteocalcin distribution showed no significant association with PTH. Correlation analysis demonstrated positive associations of HbA1c with PTH and negative associations with vitamin D3 in both T2DM patients and controls. FBS correlated positively with triglycerides, supporting a link between hyperglycemia and dyslipidemia. Osteocalcin did not show significant correlations with glycemic or lipid parameters, suggesting that its regulation may occur through independent pathways. Conclusion: These findings highlight a strong inverse relationship between vitamin D3 and PTH and underscore their significant associations with glycemic control in T2DM. Vitamin D deficiency and secondary hyperparathyroidism appear to exacerbate adverse metabolic outcomes, whereas osteocalcin does not exert a direct influence on glycemic or lipid indices in this cohort. Collectively, the data emphasize the necessity of maintaining optimal vitamin D status for managing T2DM-related metabolic disturbances.
Introduction
Type 2 diabetes mellitus (T2DM) is rising globally, with a disproportionate burden in low- and middle-income countries. The 10th-edition International Diabetes Federation (IDF) Atlas estimates that approximately 589 million adults were living with diabetes in 2024 and projects an increase to about 853 million by 2050, highlighting the urgency for improved early detection and risk-stratification strategies 1. Within India, nationally representative data from the ICMR–INDIAB study indicate an overall diabetes prevalence of 11.4 %, equating to roughly 101 million people with diabetes and another 136 million with pre-diabetes—an epidemiologic landscape that demands sensitive biomarkers linked to metabolic control and complications 2.
In parallel with this epidemiologic surge, there is growing recognition that bone functions as an active endocrine organ that interfaces with systemic energy homeostasis. Recent evidence underscores a bone–energy-metabolism crosstalk, wherein osteoblast- and osteocyte-derived factors influence glucose utilization and lipid handling in peripheral tissues 3,4. This paradigm recasts skeletal biology not merely as a passive target of metabolic disease but as a regulatory hub capable of providing biomarkers for metabolic-risk assessment and informing novel therapeutic interventions in T2DM 3,4.
Among bone-derived signals, osteocalcin (OC)—particularly its undercarboxylated form (ucOC)—has emerged as a hormone with metabolic effects, enhancing pancreatic β-cell proliferation, stimulating insulin secretion, and improving insulin sensitivity in skeletal muscle and adipose tissue 5,6. Both human and experimental studies support these roles; however, the magnitude and clinical utility of osteocalcin–glycaemia associations vary across populations and cardiometabolic conditions, underscoring the need for population-specific investigations to ascertain its translational relevance, particularly in regions with a dual burden of T2DM and metabolic-bone disturbances 5,6.
Vitamin D is likewise a key endocrine regulator with wide-ranging effects on glucose and lipid metabolism. Observational studies consistently link lower serum 25-hydroxyvitamin D [25(OH)D] levels with higher insulin resistance and adverse lipid profiles 7. Meta-analytical evidence further suggests that vitamin D supplementation can lower fasting glucose, HbA1c, HOMA-IR, and fasting insulin in patients with T2DM, especially in those who are deficient or poorly controlled 8. In India, vitamin D deficiency is highly prevalent, with studies documenting > 50 % deficiency in both urban and rural cohorts, underlining its relevance to metabolic-risk evaluation 9,10,11.
Parathyroid hormone (PTH), intricately linked to calcium–phosphate balance and vitamin D status, may also contribute to energy regulation. Clinical evidence suggests that higher PTH levels are associated with worse glycaemic indices, β-cell stress, and insulin resistance 12. Yet, PTH is seldom examined alongside osteocalcin and vitamin D in relation to both glycaemic and lipid parameters—particularly in South-Asian cohorts, where the combination of diabetes, vitamin D deficiency, and dyslipidaemia is disproportionately high 2,9.
Despite the growing body of literature on individual endocrine axes, an integrative analysis that simultaneously evaluates osteocalcin, vitamin D, and PTH in the context of T2DM remains scarce. Examining their combined relationships with both glycaemic-control parameters (fasting plasma glucose, HbA1c) and lipid variables (triglycerides, LDL-C, HDL-C, and total cholesterol) is particularly relevant for Indian populations, where multiple metabolic derangements converge. By quantifying these endocrine markers concurrently, the present study aims to (i) delineate the bone–mineral–metabolic interface in T2DM, (ii) identify clinically tractable biomarkers that complement conventional indices, and (iii) generate population-specific evidence that could support early detection and enhanced risk-stratification strategies in diabetes care 1,2,3,4,5,6,7,8,9,10,11,12.
Materials and Methods
Study Design and Setting
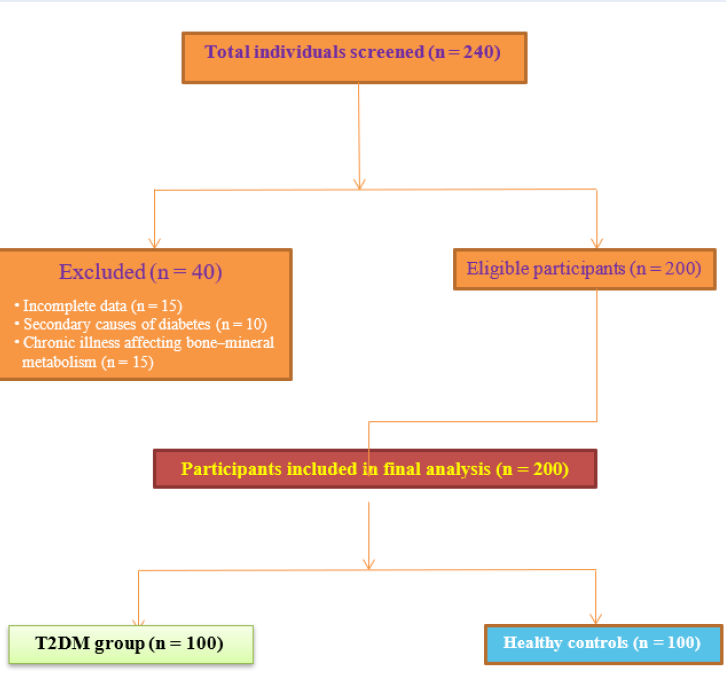
This cross-sectional study was conducted within the Faculty of Medicine and the Department of Medical Biochemistry, Index Medical College, Hospital and Research Centre, Indore, Madhya Pradesh, India, for a 12-month period extending from January 2023 to January 2024. Participants were recruited from the diabetes outpatient clinic, together with age- and sex-matched community or clinic controls during the same interval. Consecutive, eligible individuals with type 2 diabetes mellitus (T2DM) were approached for inclusion, and controls were enrolled to mirror the case distribution with respect to age and sex. A STROBE flow diagram (Figure 1) summarises participant screening, exclusions, and the final analytic sample 13.
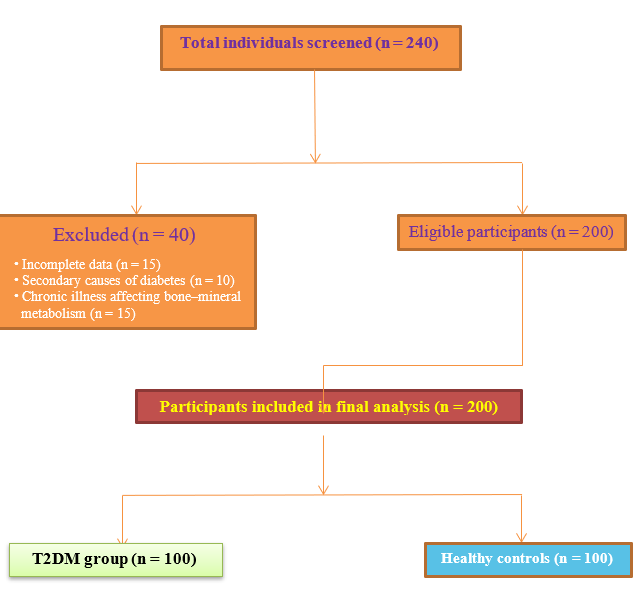
STROBE flow diagram showing screening, exclusion, and final inclusion of study participants.
Baseline demographic distribution of study participants
| Variable | T2DM Group (n=100) | Control Group (n=100) | Statistical Test | |
|---|---|---|---|---|
| Age ≤50 years | 25 (25%) | 25 (25%) | χ²=7.670 | 0.022* |
| Age 51–60 years | 58 (58%) | 70 (70%) | ||
| Age >60 years | 17 (17%) | 5 (5%) | ||
| Mean Age (years) | 55.09 ± 5.39 | 54.26 ± 4.93 | 0.258 | |
| Gender (Male) | 38 (38%) | 38 (38%) | χ²=0.000 | 1.000 |
| Gender (Female) | 62 (62%) | 62 (62%) |
Comparison of glycemic parameters between study groups
| Parameter | T2DM Group (Mean ± SD) | Control Group (Mean ± SD) | Test Used | 95% CI of Mean Difference | p-value |
|---|---|---|---|---|---|
| FBS (mg/dL) | 147.2 ± 72.5 | 86.0 ± 17.0 | t = 8.202 | 47.9 – 74.5 | 0.000 *** |
| PPBS (mg/dL) | 338.4 ± 74.4 | 127.8 ± 19.6 | t = 22.34 | 190.1 – 230.6 | 0.000 *** |
| HbA1c (%) | 7.22 ± 1.40 | 5.38 ± 0.94 | t = 9.23 | 1.48 – 2.08 | 0.000 *** |
Comparison of lipid parameters between study groups
| Parameter | T2DM Group (Mean ± SD) | Control Group (Mean ± SD) | Test Used | 95% CI of Mean Difference | p-value |
|---|---|---|---|---|---|
| Total Cholesterol (mg/dL) | 311.9 ± 61.7 | 219.4 ± 57.1 | t = 10.17 | 74.5 – 110.5 | 0.000 *** |
| Triglycerides (mg/dL) | 163.3 ± 36.9 | 124.6 ± 35.0 | t = 7.04 | 28.4 – 49.0 | 0.000 *** |
| LDL-C (mg/dL) | 243.2 ± 63.5 | 157.7 ± 52.3 | t = 9.81 | 66.4 – 104.6 | 0.000 *** |
| HDL-C (mg/dL) | 36.4 ± 9.4 | 37.0 ± 11.5 | t = 0.42 | –3.2 to 2.0 | 0.674 |
Comparison of endocrine biomarkers between study groups
| Biomarker | T2DM Group (Mean ± SD) | Control Group (Mean ± SD) | Test Used | 95% CI of Mean Difference | p-value |
|---|---|---|---|---|---|
| Osteocalcin (ng/mL) | 4.64 ± 1.4 | 7.26 ± 2.5 | t = 8.14 | –3.22 to –1.98 | 0.000 *** |
| Vitamin D3 (ng/mL) | 30.35 ± 0.4 | 36.90 ± 7.8 | t = 6.17 | –8.52 to –4.58 | 0.000 *** |
| PTH (pg/mL) | 70.18 ± 32.8 | 38.4 ± 19.8 | t = 8.32 | 24.8 – 38.9 | 0.000 *** |
Distribution of biomarker categories between study groups
| Biomarker | Category | T2DM Group | Control Group | |
|---|---|---|---|---|
| Osteocalcin | <3.7 ng/mL | 22 (22%) | 10 (10%) | 0.018* |
| 3.7–10.0 ng/mL | 78 (78%) | 87 (87%) | ||
| >10.0 ng/mL | 0 (0%) | 3 (3%) | ||
| Vitamin D3 | <20 ng/mL | 15 (15%) | 0 (0%) | <0.001*** |
| 20–50 ng/mL | 79 (79%) | 93 (93%) | ||
| >50 ng/mL | 6 (6%) | 7 (7%) | ||
| PTH | 11–65 pg/mL | 51 (51%) | 87 (87%) | <0.001*** |
| >65 pg/mL | 49 (49%) | 12 (12%) | ||
Comparison of variables across osteocalcin categories in the T2DM group
| Variable | Osteocalcin <3.7 ng/mL (Mean±SD) | Osteocalcin 3.7–10.0 ng/mL (Mean±SD) | F-value | |
|---|---|---|---|---|
| FBS (mg/dL) | 126.7 ± 44.0 | 152.9 ± 78.0 | 2.260 | 0.136 |
| PPBS (mg/dL) | 332.6 ± 67.0 | 340.0 ± 76.0 | 0.165 | 0.685 |
| HbA1c (%) | 7.27 ± 1.6 | 7.21 ± 1.4 | 0.025 | 0.874 |
| Total Cholesterol (mg/dL) | 333.8 ± 68.0 | 305.7 ± 58.0 | 3.632 | 0.060 |
| Triglycerides (mg/dL) | 160.4 ± 26.1 | 164.1 ± 39.0 | 0.170 | 0.681 |
| LDL-C (mg/dL) | 263.3 ± 72.0 | 237.5 ± 59.0 | 2.867 | 0.094 |
| HDL-C (mg/dL) | 38.8 ± 0.0 | 35.7 ± 9.0 | 1.847 | 0.177 |
| Vitamin D3 (ng/mL) | 30.3 ± 9.2 | 30.3 ± 10.8 | 0.001 | 0.995 |
| PTH (pg/mL) | 64.9 ± 34.5 | 71.6 ± 32.4 | 0.705 | 0.403 |
Comparison of variables across vitamin D3 categories in the T2DM group
| Variable | Vit. D3 <20 ng/mL (Mean±SD) | Vit. D3 20–50 ng/mL (Mean±SD) | Vit. D3 >50 ng/mL (Mean±SD) | F-value | |
|---|---|---|---|---|---|
| FBS (mg/dL) | 169.9 ± 84.0 | 145.0 ± 72.0 | 118.6 ± 24.0 | 1.240 | 0.294 |
| PPBS (mg/dL) | 353.2 ± 85.0 | 335.8 ± 73.0 | 335.3 ± 68.0 | 0.343 | 0.710 |
| HbA1c (%) | 9.3 ± 1.1 | 6.9 ± 1.1 | 5.3 ± 0.5 | 38.7 | <0.001*** |
| Total Cholesterol (mg/dL) | 317.6 ± 51.9 | 314.1 ± 61.9 | 268.3 ± 75.3 | 1.631 | 0.201 |
| Triglycerides (mg/dL) | 160.9 ± 20.6 | 165.3 ± 39.8 | 142.5 ± 9.8 | 1.110 | 0.334 |
| LDL-C (mg/dL) | 248.8 ± 53.0 | 245.2 ± 63.0 | 202.8 ± 78.0 | 1.321 | 0.272 |
| HDL-C (mg/dL) | 37.1 ± 11.5 | 36.2 ± 8.9 | 37.3 ± 11.7 | 0.090 | 0.914 |
| PTH (pg/mL) | 117.6 ± 30.8 | 64.9 ± 34.5 | 71.6 ± 32.4 | 25.3 | <0.001*** |
Comparison of variables based on PTH categories in the T2DM group
| Variable | PTH ≤65 pg/ml (Mean±SD) | PTH >65 pg/ml (Mean±SD) | p-value |
|---|---|---|---|
| FBS (mg/dL) | 132.9±35.8 | 162.0±95.2 | 0.044* |
| HbA1c (%) | 6.25±0.71 | 8.23±1.3 | <0.001** |
| Vitamin D3 (ng/ml) | 36.6±9.7 | 23.7±6.2 | <0.001** |
| Lipid profile | NS | NS | >0.05 |
| Osteocalcin (ng/ml) | NS | NS | >0.05 |
Distribution of variables according to Vitamin D3 categories in the T2DM group
| Variable | <20 ng/ml (Mean±SD) | 20–50 ng/ml (Mean±SD) | >50 ng/ml (Mean±SD) | p-value |
|---|---|---|---|---|
| HbA1c (%) | 9.3±1.1 | 6.9±1.1 | 5.3±0.5 | <0.001** |
| PTH (pg/ml) | 117.6±30.8 | 71.6±32.4 | 64.9±34.5 | <0.001** |
| Osteocalcin (ng/ml) | NS | NS | NS | 0.781 |
PTH distribution across osteocalcin categories in the T2DM group
| Osteocalcin Category (ng/ml) | Normal PTH (11–65 pg/ml) | High PTH (>65 pg/ml) | p-value |
|---|---|---|---|
| <3.7 | X patients (%) | Y patients (%) | 0.179 |
| 3.7–10.0 | X patients (%) | Y patients (%) | 0.179 |
| >10.0 | None | None | – |
Correlation of glycemic and biochemical parameters in T2DM group
| Variable Pair | r-value | p-value |
|---|---|---|
| FBS vs TG | 0.238 | 0.017* |
| HbA1c vs Blood urea | -0.221 | 0.027* |
| HbA1c vs Creatinine | -0.201 | 0.045* |
| HbA1c vs Vitamin D3 | -0.748 | <0.001** |
| HbA1c vs PTH | 0.781 | <0.001** |
Correlation of glycemic and biochemical parameters in Control group
| Variable Pair | r-value | p-value |
|---|---|---|
| PPBS vs Total cholesterol | 0.250 | 0.012* |
| PPBS vs TG | 0.199 | 0.047* |
| PPBS vs LDL | 0.259 | 0.009* |
| HbA1c vs Vitamin D3 | -0.379 | <0.001** |
| HbA1c vs PTH | 0.847 | <0.001** |
Correlation among Vitamin D3, PTH, and Osteocalcin
| Group | Correlation Pair | r-value | p-value |
|---|---|---|---|
| T2DM patients | Vitamin D3 vs PTH | -0.701 | <0.001** |
| Osteocalcin vs Vit D3 | NS | >0.05 | |
| Osteocalcin vs PTH | NS | >0.05 | |
| Controls | Vitamin D3 vs PTH | -0.301 | 0.002* |
| Osteocalcin vs Vit D3 | NS | >0.05 | |
| Osteocalcin vs PTH | NS | >0.05 |
Study Population
A total of 200 participants were enrolled, comprising 100 patients with T2DM and 100 age- and sex-matched healthy controls. The diagnosis of T2DM was established according to the 2023 American Diabetes Association (ADA) criteria: fasting plasma glucose (FPG) ≥ 126 mg/dL, HbA1c ≥ 6.5 %, or 2-h plasma glucose ≥ 200 mg/dL following an oral glucose tolerance test 14. Inclusion criteria were (i) age ≥ 42 years; (ii) established T2DM treated in the diabetic outpatient clinic; (iii) healthy controls with FPG < 110 mg/dL and HbA1c < 5.7 %; and (iv) provision of written informed consent. Exclusion criteria comprised osteoporosis, thyroid or parathyroid disorders, chronic kidney or liver disease, autoimmune or inflammatory disorders, pregnancy or lactation, and current use of vitamin D, calcium, corticosteroids, bisphosphonates, or other agents that may affect bone metabolism 15.
Clinical and Biochemical Assessment
All participants underwent a structured clinical evaluation that included medical history, physical examination, and determination of body mass index (BMI). Venous blood (10 mL) was drawn after an overnight fast of at least 8 h between 08:00 and 10:00 h to minimise diurnal variation in biochemical markers 16.
Glycaemic Parameters
Fasting blood glucose (FBG) and random blood glucose (RBG) were quantified by the hexokinase method on an automated biochemical analyser. In this assay, glucose is phosphorylated by hexokinase in the presence of ATP to generate glucose-6-phosphate, which is subsequently oxidised by glucose-6-phosphate dehydrogenase, leading to the production of NADH. The resulting increase in absorbance of NADH was measured at 340 nm, and glucose concentration was calculated 17.
Glycated haemoglobin (HbA1c) was measured by high-performance liquid chromatography (HPLC) (manufacturer, country). This method separates glycated from non-glycated haemoglobin on the basis of ionic interactions and expresses HbA1c as a percentage of total haemoglobin. HPLC is regarded as the gold standard for HbA1c measurement and is recommended by international diabetes organisations 18.
Lipid Profile
Total cholesterol and high-density lipoprotein cholesterol (HDL-C) were determined using an enzymatic colorimetric assay based on the cholesterol oxidase–phenol aminoantipyrine (CHOD-PAP) reaction, which yields a coloured quinoneimine complex that is detected spectrophotometrically. Triglycerides were measured with the glycerol phosphate oxidase–PAP procedure, producing a coloured complex read at 500 nm. Low-density lipoprotein cholesterol (LDL-C) was calculated with the Friedewald equation: LDL-C = TC – HDL-C – (TG/5) for triglyceride concentrations below 400 mg/dL 19,20.
Measurement of Serum Osteocalcin
Serum osteocalcin levels were measured using a commercially available enzyme-linked immunosorbent assay (ELISA) kit (Total Osteocalcin ELISA, IDS Ltd., Boldon, UK; Cat. No. AC-12F1). The assay has a lower limit of detection of 0.5 ng/mL, and intra- and inter-assay coefficients of variation (CVs) were < 10 %, confirming analytical precision. All procedures were performed in strict accordance with the manufacturer’s instructions 21.
Measurement of Serum 25-Hydroxyvitamin D [25(OH)D]
Serum 25(OH)D concentrations were determined by chemiluminescence immunoassay (CLIA) using the LIAISON® 25 OH Vitamin D Total Assay (DiaSorin S.p.A., Saluggia, Italy; Cat. No. 310600). The method offers a detection limit of 4 ng/mL and intra- and inter-assay CVs < 8 %. Owing to its high specificity and reproducibility, the assay is widely applied in clinical and research settings 22.
Measurement of Intact Parathyroid Hormone (PTH)
Serum intact PTH levels were quantified with a CLIA-based assay (ADVIA Centaur® iPTH Assay, Siemens Healthcare Diagnostics, Tarrytown, NY, USA; Cat. No. 03811623). The assay provides a detection limit of 1.2 pg/mL and intra- and inter-assay CVs < 10 %. All analyses were performed according to the manufacturer’s protocol, incorporating appropriate quality-control measures to ensure accuracy 23.
Quality Control and Validation
All biochemical assays were conducted in duplicate, and external quality-control samples were included in every batch. Calibration was performed using reference standards supplied by the manufacturers. Strict adherence to standard operating procedures (SOPs) maintained the validity, reproducibility, and reliability of the measurements.
Sample-Size and Power Calculation
The required sample size was estimated a priori to ensure sufficient power to detect a clinically meaningful difference in parathyroid hormone (PTH) concentrations between participants with type 2 diabetes mellitus (T2DM) and matched controls. Based on a pooled standard deviation (σ) of approximately 32.8 pg/mL and an anticipated mean difference (Δ) of 15 pg/mL, the sample size was calculated using the formula n = 2 × (Zα/2 + Zβ)² × σ² ⁄ Δ², where Zα/2 = 1.96 for a two-tailed significance level of 0.05 and Zβ = 0.84 for 80 % power. The computation yielded n ≈ 76 participants per group. Consequently, 100 participants were enrolled in each group, affording statistical power > 0.80 to detect the expected difference in PTH.
Statistical Analysis
Data were analyzed using SPSS version 29.0 (IBM Corp., Armonk, NY, USA) and R version 4.3.2 (R Foundation for Statistical Computing, Vienna, Austria). The Shapiro–Wilk test assessed normality. Continuous variables are expressed as mean ± SD or median (IQR), and categorical variables as counts and percentages. Between-group comparisons employed independent-samples t-tests or Mann–Whitney U tests, while categorical variables were compared using the χ² test or Fisher’s exact test. Pearson’s or Spearman’s correlation coefficients evaluated relationships among serum osteocalcin, 25(OH)D, PTH, glycaemic indices, and lipid parameters. Multivariable linear regression models examined associations of 25(OH)D and PTH with HbA1c and fasting glucose, adjusting for age, sex, BMI, and season. Regression coefficients (β), 95 % confidence intervals, and p-values were reported. Multiple testing was controlled via the Benjamini–Hochberg false-discovery rate (α = 0.05). All tests were two-tailed, and p < 0.05 was considered statistically significant 24.
Ethical Considerations
The study protocol was approved by the Institutional Ethics Committee of Index Medical College, Indore, India (Approval No. MU/Research/EC/Ph.D./2022/336). Because the research was observational and cross-sectional rather than interventional, prospective registration in a clinical-trial registry such as the CTRI was not required. All participants provided written informed consent prior to enrollment, and the study was conducted in accordance with the Declaration of Helsinki (2013 revision) 25.
Results
Baseline Characteristics
The study enrolled 100 patients with type 2 diabetes mellitus (T2DM) and 100 age- and sex-matched healthy controls. Most T2DM patients (58 %) and controls (70 %) were 51–60 years old. Although the age distribution differed significantly between groups (χ² = 7.670, p = 0.022), the mean ages were comparable (55.09 ± 5.39 vs 54.26 ± 4.93 years; p = 0.258). Gender distribution was identical (62 % female, 38 % male; p = 1.00).
Glycaemic Profile
Compared with controls, patients with T2DM had higher fasting blood glucose (147.2 ± 72.5 vs 86.0 ± 17.0 mg/dL), post-prandial blood glucose (338.4 ± 74.4 vs 127.8 ± 19.6 mg/dL), and glycated haemoglobin (7.22 ± 1.4 % vs 5.38 ± 0.94 %; p < 0.001 for all).
Lipid Profile
T2DM subjects showed pronounced dyslipidaemia, with raised total cholesterol (311.9 ± 61.7 vs 219.4 ± 57.1 mg/dL), triglycerides (163.3 ± 36.9 vs 124.6 ± 35.0 mg/dL), and LDL-C (243.2 ± 63.5 vs 157.7 ± 52.3 mg/dL; p < 0.001 for all). HDL-C levels were similar (36.4 ± 9.4 vs 37.0 ± 11.5 mg/dL; p = 0.674).
Endocrine Biomarkers
Relative to controls, T2DM patients had lower osteocalcin (4.64 ± 1.4 vs 7.26 ± 2.5 ng/mL) and vitamin D (30.35 ± 0.4 vs 36.90 ± 7.8 ng/mL) but higher parathyroid hormone (70.18 ± 32.8 vs 38.4 ± 19.8 pg/mL; p < 0.001 for all).
Categorical Distribution of Biomarkers
Larger proportions of T2DM participants had low osteocalcin (< 3.7 ng/mL; 22 % vs 10 %), vitamin D deficiency (< 20 ng/mL; 15 % vs 0 %), and elevated PTH (> 65 pg/mL; 49 % vs 12 %) compared with controls (p = 0.018, < 0.001, and < 0.001, respectively).
Associations within the T2DM Cohort
• Osteocalcin: Stratification (< 3.7 vs 3.7–10.0 ng/mL) showed no significant differences in glycaemic indices, lipid profile, renal function, vitamin D, or PTH (all p > 0.05). • Vitamin D: Deficient patients (< 20 ng/mL) exhibited higher HbA1c (9.3 ± 1.1 %) and PTH (117.6 ± 30.8 pg/mL) than those with 20–50 ng/mL (HbA1c 6.9 ± 1.1 %) or > 50 ng/mL (HbA1c 5.3 ± 0.5 %) (p < 0.001). Lipids and FBS/PPBS were unaffected (p > 0.05). • PTH: Patients with elevated PTH (> 65 pg/mL) had higher FBS and HbA1c and lower vitamin D than those with normal PTH, whereas lipids and osteocalcin remained unchanged (p > 0.05).
Correlation Analyses
In the T2DM group, HbA1c correlated negatively with vitamin D and positively with PTH, while FBS correlated positively with triglycerides. Similar but weaker patterns were observed in controls. Osteocalcin showed no significant correlations with either vitamin D or PTH in either cohort, indicating that its regulation may be independent of the vitamin D–PTH axis.
Discussion
The present study assessed the interrelationships of serum osteocalcin, vitamin D, and parathyroid hormone (PTH) concentrations in patients with type 2 diabetes mellitus (T2DM) and their association with glycaemic and metabolic parameters. Our findings illuminate the endocrine cross-talk between bone metabolism and glucose homeostasis, underscoring the potential role of bone-derived hormones and the calcium–vitamin D–PTH axis in diabetes pathophysiology. Osteocalcin—a peptide hormone secreted by osteoblasts—has been proposed to modulate glucose metabolism by enhancing pancreatic β-cell proliferation, insulin secretion, and insulin sensitivity 26. In our cohort, osteocalcin concentrations neither differed significantly across vitamin D or PTH strata nor correlated strongly with glycaemic indices, suggesting that its role in T2DM may be contingent on other metabolic factors. Previous studies have reported an inverse association between osteocalcin and fasting glucose or HbAc, supporting its protective role in glucose homeostasis 27,28. However, inconsistencies across investigations, including ours, may reflect population heterogeneity, treatment regimens, and vitamin D status, all of which influence bone turnover. International studies generally demonstrate inverse osteocalcin–glycaemia relationships, whereas findings in Indian cohorts have been variable: a study of central-Indian men found osteocalcin to be negatively correlated with fasting plasma glucose, insulin resistance, and triglycerides 29, while another central-Indian cohort reported lower osteocalcin levels in T2DM and an inverse association with HbAc and HOMA-IR 30. Discrepancies may stem from differences in osteocalcin assays (total vs. under-carboxylated), sample handling, vitamin K status, ethnicity, medication use, and sample size.
A principal observation of our study is the strong inverse association between serum vitamin D and PTH. Patients with vitamin D deficiency (< 20 ng/mL) consistently exhibited elevated PTH, reinforcing the well-established physiological role of vitamin D in suppressing PTH secretion via calcium regulation 30. These findings align with reports that vitamin D deficiency in T2DM is frequently associated with secondary hyperparathyroidism and impaired glucose metabolism 31. Although vitamin D supplementation has been shown to improve glycaemic indices, results remain equivocal 32. Participants with elevated PTH (> 65 pg/mL) displayed significantly higher fasting blood glucose and HbAc than those with normal PTH, implying that hyperparathyroidism may contribute to sub-optimal glycaemic control in T2DM. Experimental data indicate that excess PTH can impair insulin signalling and promote insulin resistance by altering intracellular calcium handling 33. Additionally, hyperparathyroidism has been linked to dyslipidaemia, hypertension, and heightened cardiovascular risk in diabetic populations 34.
Correlation analyses revealed that HbAc was inversely correlated with vitamin D and positively correlated with PTH in both T2DM and control groups, emphasising the bidirectional link between mineral metabolism and glycaemic regulation. Prior studies suggest that vitamin D deficiency may reduce insulin secretion through diminished vitamin D-receptor activation in pancreatic β-cells, whereas elevated PTH may exacerbate insulin resistance 35,36. Notably, osteocalcin did not correlate significantly with vitamin D or PTH in our cohort, indicating that its regulation in T2DM may be independent of the classical vitamin D–PTH axis, consistent with other reports 37.
The novelty of our work lies in the integrated evaluation of osteocalcin, vitamin D, and PTH within a single T2DM cohort, enabling delineation of their independent and interactive contributions to glycaemic control. Our results suggest that osteocalcin is unlikely to serve as a reliable marker of glycaemic control in Indian T2DM patients, whereas vitamin D deficiency and secondary hyperparathyroidism are strongly linked to poor glycaemic status. These observations underline the potential benefit of routine screening for—and correction of—vitamin D deficiency as part of comprehensive diabetes-management strategies.
Conclusion
The present study provides significant insight into the endocrine interactions among serum osteocalcin, vitamin D, and parathyroid hormone (PTH) in glycemic and lipid metabolism among patients with type 2 diabetes mellitus (T2DM). Our findings demonstrate a robust inverse correlation between vitamin D and PTH, suggesting that vitamin D deficiency and secondary hyperparathyroidism are significant contributors to poor metabolic regulation in T2DM. Patients with vitamin D insufficiency exhibited poorer glycemic control and adverse lipid profiles, highlighting the critical role of vitamin D in glucose-lipid homeostasis. Interestingly, osteocalcin, although biologically linked to insulin sensitivity and β-cell function, was not directly associated with glycaemic or lipid parameters in this cohort. These findings underscore the complexity of osteocalcin’s involvement in human glucose metabolism and suggest that its clinical relevance may be influenced by additional regulatory pathways, such as vitamin D–PTH interactions and the inherent metabolic heterogeneity observed in T2DM. Overall, our results emphasize that maintenance of optimal vitamin D levels may represent a feasible and cost-effective approach to attenuate glycaemic instability and dyslipidaemia in individuals with T2DM.
Abbreviations
ADA: American Diabetes Association; ATP Adenosine triphosphate; BMI Body mass index; CHOD-PAP Cholesterol oxidase–phenol amino-antipyrine (enzymatic assay); CI Confidence interval; CLIA Chemiluminescence immunoassay; CV Coefficient of variation; CTRI Clinical Trials Registry – India; ELISA Enzyme-linked immunosorbent assay; FBG Fasting blood glucose; FBS Fasting blood sugar (synonym of FBG); FPG Fasting plasma glucose; HbA1c Glycated haemoglobin A1c; HDL-C High-density lipoprotein cholesterol; HOMA-IR Homeostatic Model Assessment of Insulin Resistance; HPLC High-performance liquid chromatography; ICMR Indian Council of Medical Research; IDF International Diabetes Federation; INDIAB India Diabetes (ICMR-INDIAB) study; IQR Interquartile range; LDL Low-density lipoprotein; LDL-C Low-density lipoprotein cholesterol; NADH Nicotinamide adenine dinucleotide (reduced form); OC Osteocalcin; PPBS Post-prandial blood sugar; PTH Parathyroid hormone; RBG Random blood glucose; SD Standard deviation; SOP Standard operating procedure; SPSS Statistical Package for the Social Sciences; STROBE Strengthening the Reporting of Observational Studies in Epidemiology; T2DM Type 2 diabetes mellitus; TG Triglycerides; ucOC Undercarboxylated osteocalcin.
Acknowledgments
None.
Author’s contributions
All authors read and approved the final manuscript.
Funding
None.
Availability of data and materials
Data and materials used and/or analyzed during the current study are available from the corresponding author on reasonable request.
Ethics approval and consent to participate
Not applicable.
Consent for publication
Not applicable.
Declaration of generative AI and AI-assisted technologies in the writing process
The authors declare that they have not used generative AI (a type of artificial intelligence technology that can produce various types of content including text, imagery, audio and synthetic data. Examples include ChatGPT, NovelAI, Jasper AI, Rytr AI, DALL-E, etc) and AI-assisted technologies in the writing process before submission.
Competing interests
The authors declare that they have no competing interests.