

Spectroscopic Decryption of Epigenetic Remodeling Driving T Cell Exhaustion in Glioblastoma: A Path to Immunotherapeutic Reinvigoration
- Shri Venkateshwara University, India
Abstract
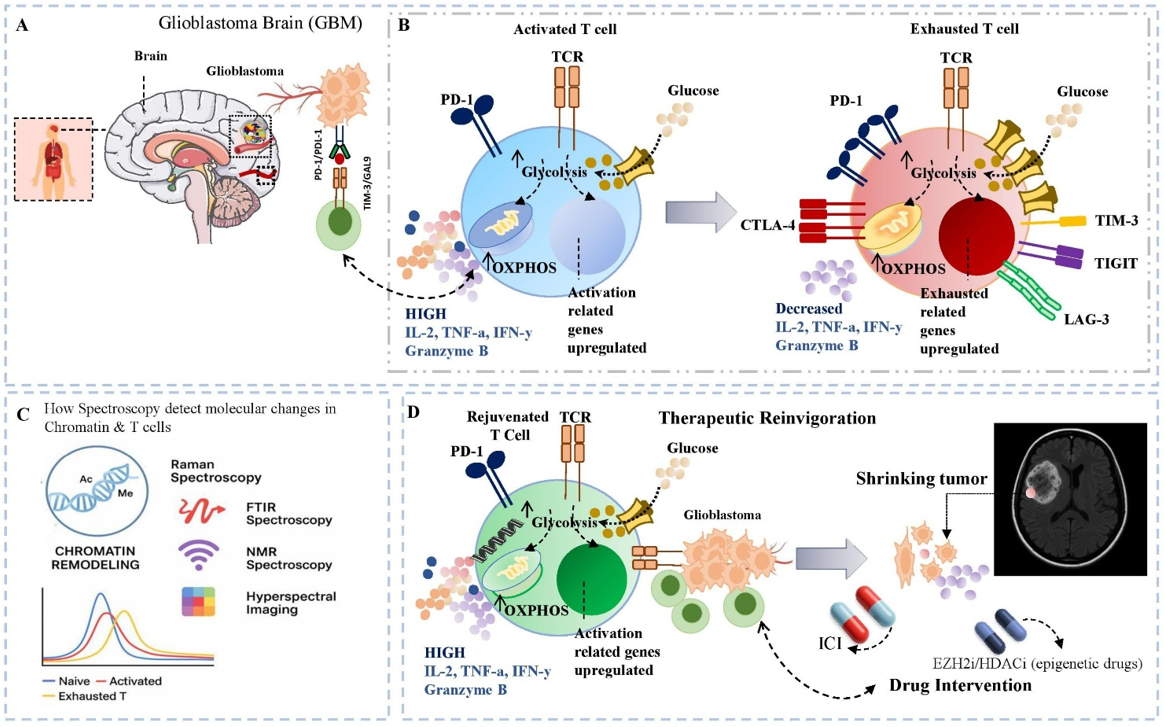
Glioblastoma (GBM) is the most aggressive and lethal primary brain tumour and remains largely refractory to immunotherapy owing to its profoundly immunosuppressive and metabolically reprogrammed tumour microenvironment (TME). A principal barrier is T-cell exhaustion—a terminally differentiated, dysfunctional state characterised by sustained expression of inhibitory immune checkpoints, transcriptional repression, epigenetic fixation, and progressive loss of cytotoxic effector function. This state is stabilised by chromatin remodelling, aberrant DNA methylation, nucleosome repositioning, histone post-translational modifications, and enhancer-landscape alterations, rendering exhausted T cells resistant to canonical immune-checkpoint blockade. High-resolution, multimodal spectroscopic technologies—including Raman scattering, Fourier-transform infrared (FTIR) spectroscopy, mass-spectrometry imaging (MSI), and surface-enhanced Raman spectroscopy (SERS)—have emerged as label-free, non-destructive, chemically sensitive tools capable of decoding the molecular and epigenomic architecture of exhausted T cells. These modalities afford spatiotemporal resolution of biomolecular alterations, capturing epigenetic asymmetries, metabolic flux, redox imbalance, lipidomic shifts, and nucleic-acid signatures that govern immune-cell fate within the GBM milieu. We hypothesise that synergistic integration of these advanced spectroscopic approaches with single-cell epigenomic and transcriptomic profiling will uncover exhaustion-specific molecular fingerprints, enable precise immune-subset stratification, and inform the development of targeted immunotherapies. This convergence of systems-level analytics with molecular interrogation could establish a transformative, non-invasive framework for immune monitoring and chromatin-directed reprogramming aimed at restoring T-cell stemness and reinvigorating durable anti-tumour immunity. By delineating spectroscopic correlates of epigenetic remodelling and immunometabolic dysfunction, this strategy may transcend current therapeutic limitations and facilitate biomarker-driven, mechanism-informed immunotherapy for GBM.
Introduction
Glioblastoma (GBM) is the most aggressive primary malignancy of the central nervous system, with a median overall survival of only 14–16 months despite maximal surgical resection, radiotherapy, and temozolomide chemotherapy 1. Its lethality largely derives from an immunosuppressive tumour microenvironment (TME) that disrupts immune surveillance and enables tumour immune evasion. GBM mediates suppression by down-regulating MHC molecules, secreting inhibitory cytokines (e.g., TGF-β, IL-10), reprogramming cellular metabolism, expressing checkpoint ligands (PD-L1, Galectin-9), and inducing T-cell exhaustion (Tex) 2,3. These barriers largely account for the limited clinical efficacy of immune-checkpoint inhibitors (ICIs) in GBM trials 4.
Tex is defined by a progressive loss of effector function under chronic antigenic stimulation. Exhausted T cells display reduced production of IL-2, IFN-γ, and TNF-α, poor proliferative capacity, metabolic dysregulation, and sustained expression of inhibitory receptors such as PD-1, TIM-3, LAG-3, CTLA-4, and TIGIT 5,6. Although early exhaustion can be partially reversed by checkpoint blockade, prolonged stimulation drives an epigenetically fixed terminal state that is refractory to reinvigoration 7.
This terminal phenotype is orchestrated by extensive epigenetic remodelling—changes in chromatin accessibility, DNA methylation, and histone modifications that occur without altering the DNA sequence 8. Tex cells within GBM possess a unique chromatin landscape marked by effector-gene repression and up-regulation of transcription factors such as TOX, NR4A, and EOMES 9. Single-cell ATAC-seq and ChIP-seq have identified exhaustion-specific enhancers and super-enhancers, underscoring the durability of this programme 10. However, studying these dynamics in patients remains challenging owing to the absence of real-time, non-invasive tools capable of interrogating epigenetic states in situ.
Advanced spectroscopic technologies—including Raman spectroscopy, Fourier-transform infrared (FTIR) spectroscopy, and mass spectrometry—can meet this need 11. These label-free, non-destructive modalities exploit intrinsic vibrational or mass signatures to yield spatially resolved biochemical profiles of nucleic acids, proteins, lipids, and metabolites, all of which are altered during Tex 12,13. Raman microspectroscopy, for instance, can differentiate naïve, activated, and exhausted T cells on the basis of vibrational fingerprints associated with DNA methylation, histone acetylation, and metabolic reprogramming 14, while FTIR spectroscopy detects spectral biomarkers of epigenetic and transcriptional states 15.
Integrating these spectroscopic approaches with single-cell sequencing and machine-learning algorithms could define exhaustion-specific signatures, enabling immune monitoring and early detection of therapeutic resistance. Such convergence is particularly relevant in GBM, where intratumoral heterogeneity, the blood–brain barrier, and immune exclusion limit tissue-based assessments 16. Correlating spectroscopic profiles with transcriptional and epigenetic data may also guide the use of epigenetic adjuvants (e.g., DNMT or HDAC inhibitors) to reset Tex chromatin landscapes and enhance ICI responsiveness 17.
This review therefore proposes an integrative framework that leverages spectroscopy to interrogate epigenetic remodelling in T-cell exhaustion, summarizes key mechanistic insights, evaluates spectroscopic modalities, and discusses their translational applications in immune monitoring, biomarker discovery, and therapeutic stratification for GBM.
Literature Search and Selection
References for this narrative review were obtained through comprehensive searches of PubMed, Web of Science, and Scopus, encompassing publications from 2018 to 2025. Search terms consisted of various combinations of “glioblastoma,” “T-cell exhaustion,” “epigenetics,” “immunotherapy,” “spectroscopy,” and “immune checkpoint inhibitors.” Additional pertinent articles were identified by manually screening the reference lists of seminal studies and recent reviews. Articles were selected on the basis of relevance, novelty, and scientific impact; a formal systematic review or meta-analysis protocol was not employed.
The Immunological and Epigenetic Landscape of Glioblastoma
T-Cell Dysfunction and Exhaustion in GBM
Glioblastoma (GBM) establishes a profoundly immunosuppressive tumor microenvironment (TME) that blunts cytotoxic immunity, primarily through T-cell dysfunction. Tumor-infiltrating lymphocytes (TILs) are scarce, undergo limited expansion, produce few cytokines, and are frequently confined to perivascular niches rather than infiltrating tumor cores 18,19. Single-cell RNA sequencing and T-cell receptor (TCR) repertoire analyses confirm that the majority of CD8 TILs acquire a terminally exhausted phenotype, characterized by high expression of PD-1 (PDCD1), TIM-3 (HAVCR2), and LAG-3 (LAG3) 20. These co-inhibitory receptors are sustained by chronic antigen stimulation within the antigen-rich yet immunologically inert GBM milieu 21. Exhaustion is further stabilized by transcriptional regulators such as TOX and the NR4A family (NR4A1/2/3). TOX functions as a master epigenetic organizer, remodeling chromatin to lock dysfunctional transcriptional programs while repressing effector signatures 22,23. NR4A factors likewise impose tolerogenic states and directly suppress IL-2 and IFN-γ production 24. In concert with checkpoint signaling, these factors constrain metabolic plasticity. The hypoxic and nutrient-poor GBM TME exacerbates dysfunction by depleting ATP, elevating reactive oxygen species (ROS) and limiting mitochondrial biogenesis 25. Spatial profiling indicates that exhaustion is maximal at the tumor margin, whereas the core is almost devoid of TILs 26, underscoring both focal immune suppression and an epigenetically fixed exhausted state refractory to reversal.
Epigenetic Fixation of Exhaustion
A major barrier to effective GBM immunotherapy is the epigenetic fixation of T-cell exhaustion, whereby dysfunctional programs become durably imprinted and refractory to re-invigoration. Exhausted T cells acquire not only altered transcriptional states but also a distinct epigenomic identity that irrevocably separates them from memory and effector lineages 27. DNA methylation is central to this process. Whole-genome bisulfite sequencing and chromatin accessibility profiling reveal hypermethylation of loci governing IL-2 signaling, cytolytic effectors (e.g., GZMB, PRF1), and co-stimulatory receptors such as CD28 28. DNMT3A serves as a critical mediator; conditional deletion of Dnmt3a in CD8 T cells partially restores effector function and increases responsiveness to PD-1 blockade in pre-clinical GBM models 29. Raman micro-spectroscopy further demonstrates methylation-driven chromatin compaction within exhausted nuclei.
Histone modifications consolidate repression. Trimethylation of histone H3 lysine 27 (H3K27me3), catalyzed by EZH2 within the polycomb repressive complex 2 (PRC2), is enriched at effector cytokine and receptor loci 30. Chromatin immunoprecipitation sequencing (ChIP-seq) confirms pervasive H3K27me3-marked silencing in exhausted TILs from human GBM 31. Pharmacological EZH2 inhibition synergizes with PD-1 blockade, restoring IFN-γ production and proliferation in glioma models 32. Single-cell ATAC-seq and CUT&Tag provide high-resolution maps of this chromatin landscape. Patient-derived exhausted T cells exhibit loss of accessible enhancers governing effector and memory programs 33. Exhaustion-specific super-enhancers regulated by TOX display H3K4me1 enrichment coupled with H3K27ac depletion, indicative of functional silencing 34. These chromatin alterations persist ex vivo, emphasizing durable epigenetic entrapment. Collectively, DNA methylation, histone modifications, and chromatin compaction entrench a fate-committed exhaustion program. Even under checkpoint blockade, exhausted T cells rarely reacquire effector competence. Consequently, of checkpoint inhibitors (e.g., HDAC, BET, or EZH2 inhibitors) are under investigation to restore T-cell plasticity and overcome GBM-mediated immune resistance 35,36.
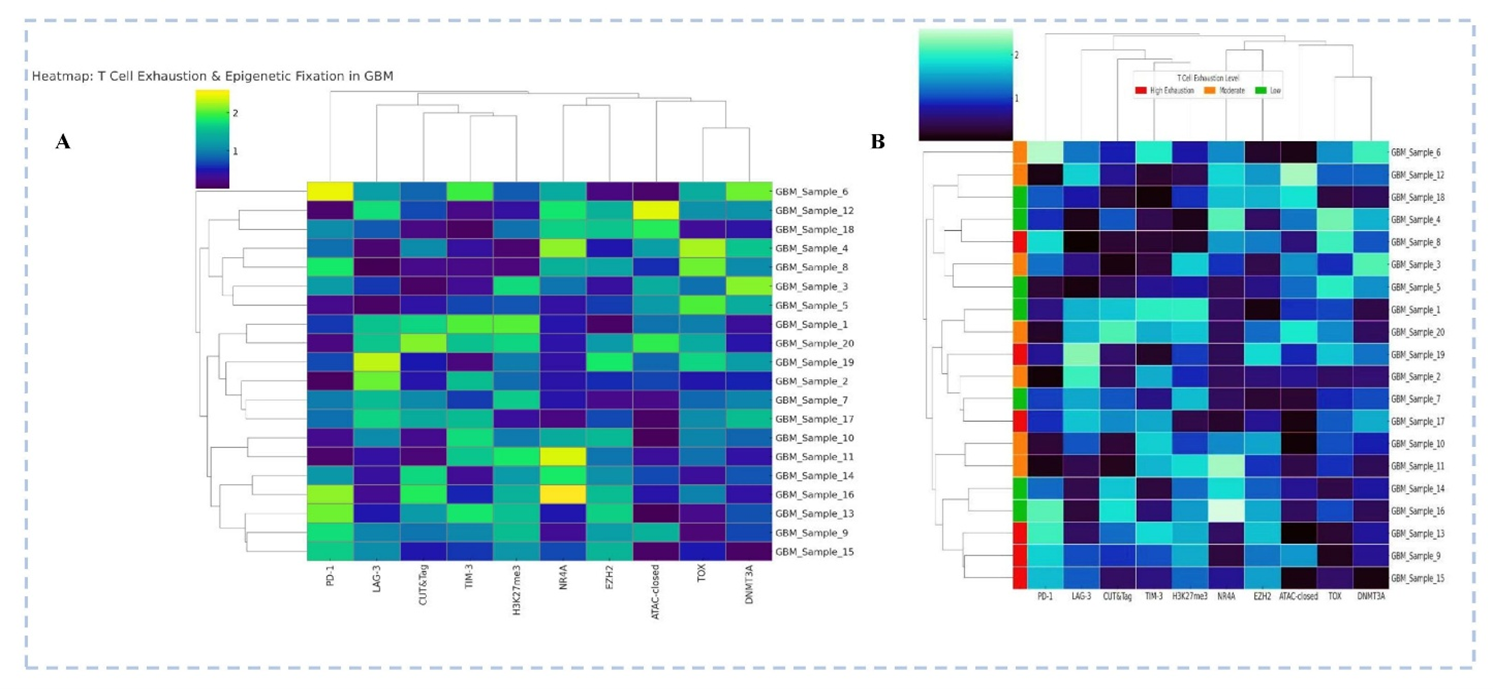
Heatmap Depicting T Cell Exhaustion Markers and Epigenetic Regulatory Profiles in Glioblastoma (GBM) Samples (A) Hierarchical clustering of 20 GBM samples based on expression of T cell exhaustion markers (PD-1, LAG-3, TIM-3, TOX) and epigenetic regulators (H3K27me3, NR4A, EZH2, DNMT3A, ATAC-closed chromatin state). (B) The same heatmap with color-coded annotation bars indicating relative exhaustion states (red: high; orange: moderate; green: low) based on cumulative marker expression. CUT&Tag-based chromatin accessibility and histone methylation patterns highlight epigenetic fixation associated with T cell dysfunction. Sample clustering reveals patient-specific exhaustion-epigenetic signatures, suggesting that deeper exhaustion correlates with repressive chromatin marks (e.g., H3K27me3, ATAC-closed) and TOX/EZH2 enrichment. [Illustration created in PowerPoint] Note: This figure is illustrative and uses simulated/mock data for conceptual purposes only; it does not represent patient-level or trial data. For definitions of abbreviations (e.g., CUT&Tag, ATAC-seq, EZH2), please refer to the 'Abbreviations' section.
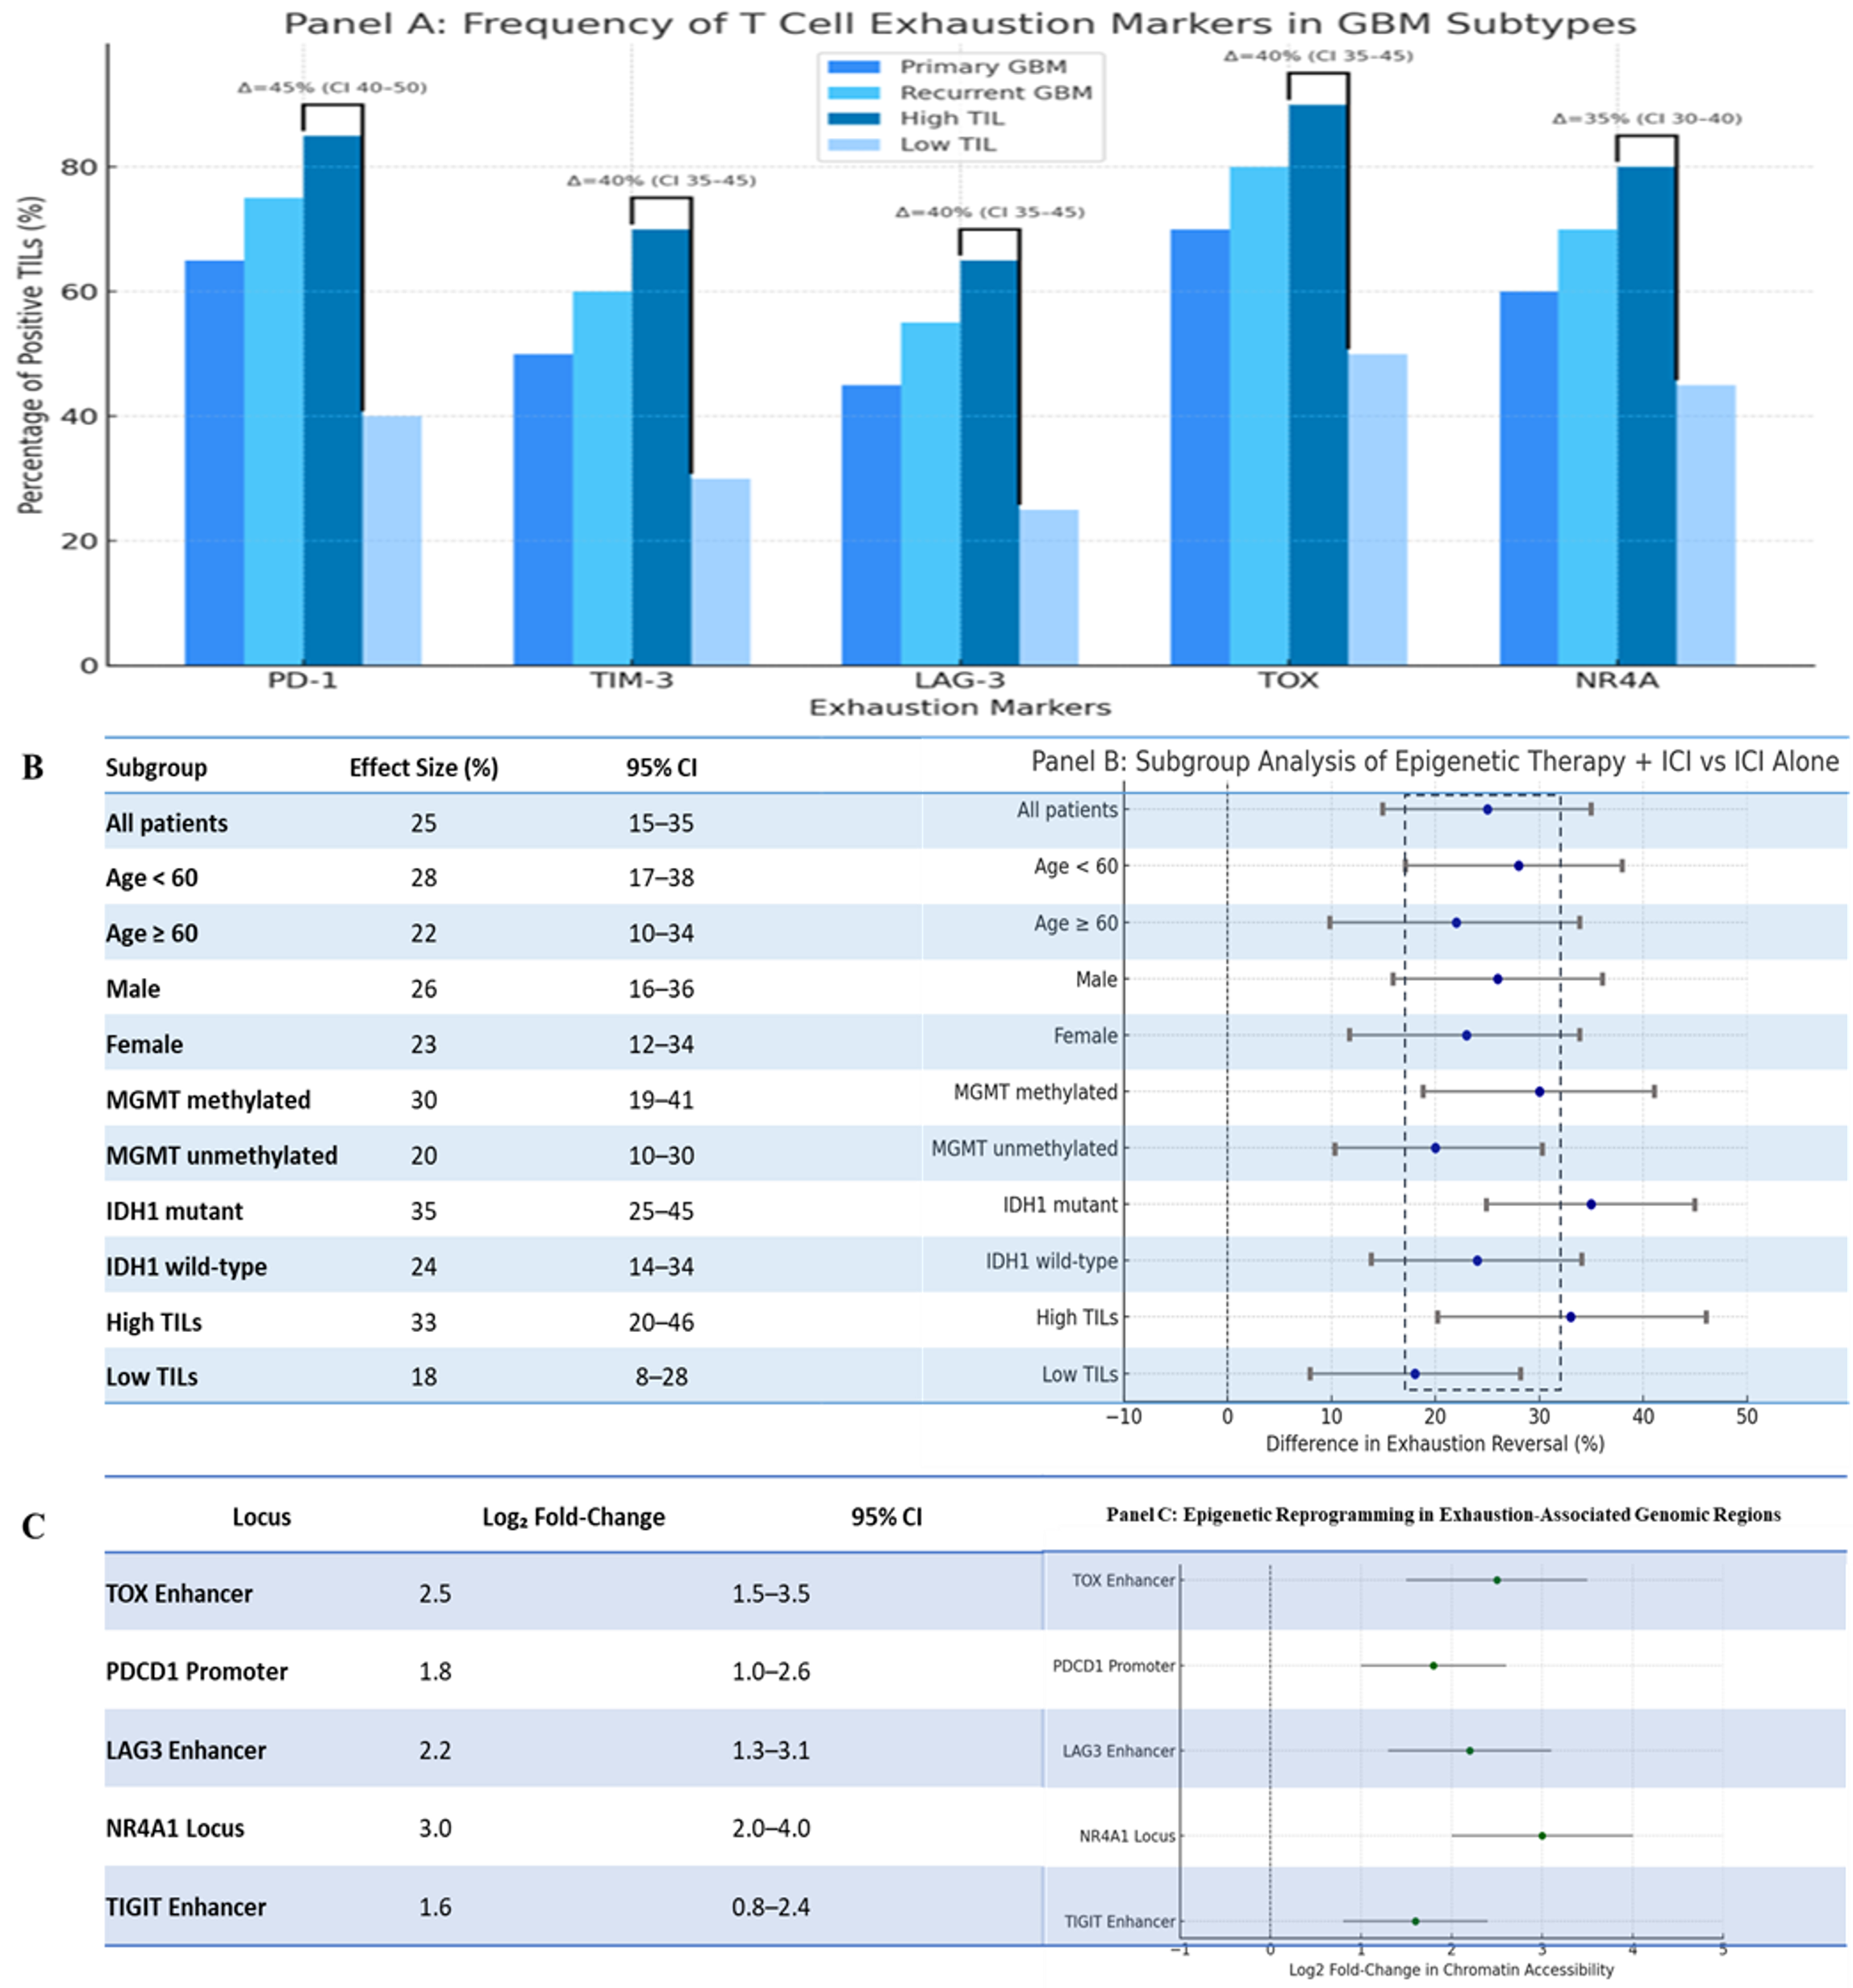
Multi-Dimensional Profiling of T Cell Exhaustion in Glioblastoma: Frequency, Subgroup Responsiveness, and Epigenetic Remodelling. A: Expression Frequencies of Canonical Exhaustion Markers in GBM Tumor-Infiltrating Lymphocytes (TILs). This bar graph illustrates the relative abundance of T cell exhaustion markers PD-1, TIM-3, LAG-3, TOX, and NR4A across four GBM subtypes: primary GBM, recurrent GBM, high TIL density, and low TIL density tumors. The blue-toned colour gradient distinguishes each cohort. Notably, high TIL tumors exhibit markedly increased expression of all exhaustion markers, with statistically inferred differences (Δ%) highlighted between high and low TIL groups using top-line comparisons annotated with simulated confidence intervals. These trends underscore the progressive immunosuppressive milieu and potential predictive value of exhaustion signatures in stratifying immunotherapy responsiveness. B: Subgroup-Specific Responses to Combined Epigenetic and Checkpoint Blockade Therapies- This forest plot presents a simulated subgroup analysis comparing the percentage improvement in functional T cell exhaustion reversal upon treatment with epigenetic reprogramming agents (e.g., HDAC inhibitors) in combination with immune checkpoint inhibitors, versus ICI monotherapy. Subgroups analysed include patient demographics (age, sex), molecular profiles (MGMT methylation, IDH1 mutation), and immune contexture (TIL density). Effect sizes are reported with 95% confidence intervals, revealing pronounced benefit in MGMT-methylated, IDH1-mutant, and highly inflamed tumors, indicative of a potential for precision stratification of epigenetic-immune combination therapies. C: Epigenetic Reprogramming at Exhaustion-Associated Loci in T Cells from GBM- This panel shows log2 fold-changes in chromatin accessibility derived from simulated ATAC-seq/Chipset data at regulatory regions associated with T cell exhaustion, including TOX enhancers, PDCD1 promoters, and loci of LAG3, NR4A1, and TIGIT. Enhanced accessibility in exhausted T cells or post-treatment reprogrammed cells suggests a mechanistic basis for transcriptional reawakening and the potential for epigenetic decryption of exhaustion states. The confidence intervals underscore biologically meaningful remodelling of the chromatin landscape upon intervention. [Illustration created in PowerPoint]. Note: This figure is illustrative and uses simulated/mock data for conceptual purposes only; it does not represent patient-level or trial data. For definitions of abbreviations (e.g., CUT&Tag, ATAC-seq, EZH2), please refer to the 'Abbreviations' section.
Spectroscopy as a Window into Immune and Epigenetic States
Traditionally, investigations of immune-cell dynamics and chromatin remodeling in cancer and autoimmunity have depended on invasive, label-based approaches. Recent advances in vibrational and resonance spectroscopies now afford label-free interrogation of the biochemical and biophysical hallmarks of immune activation, epigenetic reprogramming, and cellular heterogeneity. These non-destructive modalities—including Raman and Fourier-transform infrared (FTIR) spectroscopy, hyperspectral imaging, and nuclear magnetic resonance (NMR)—provide a multimodal platform for elucidating the molecular mechanisms underlying immune dysregulation and epigenetic control in diseases such as glioblastoma, melanoma, and systemic lupus erythematosus (SLE) 37,38 (Figure 3).
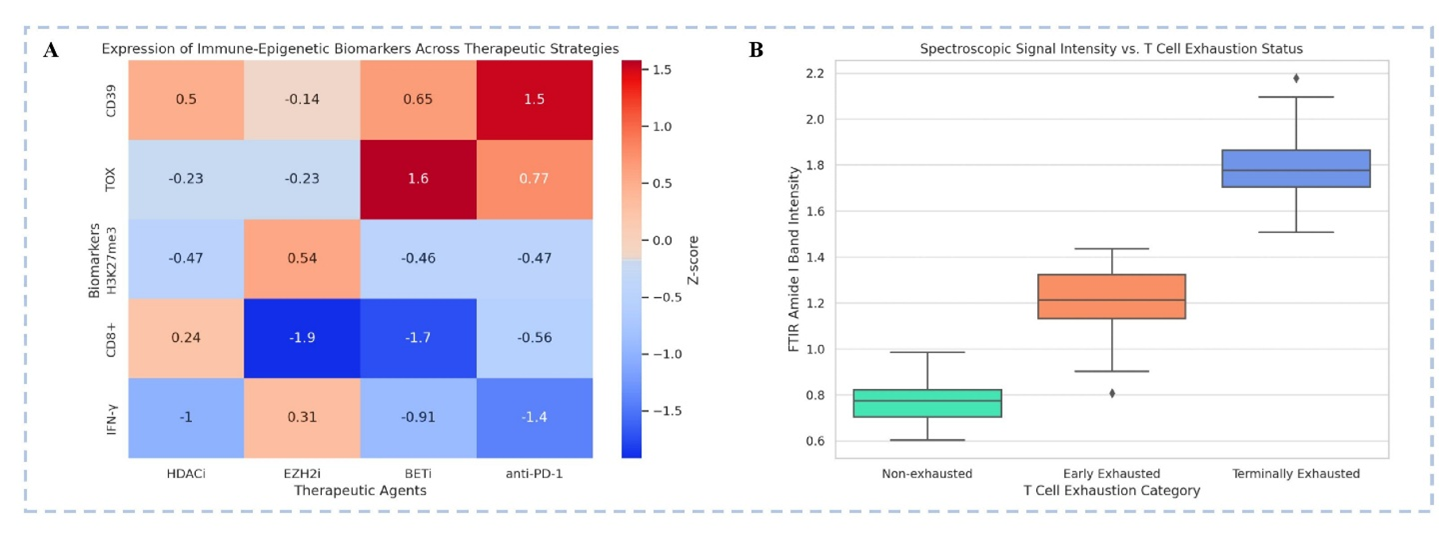
Spectroscopic and Epigenetic Signatures in T Cell Exhaustion: Implications for Therapeutic Reversal. A: Immune-Epigenetic Biomarker Expression Across Therapeutic Strategies- This heatmap depicts the Z-scores of key immune-epigenetic markers (rows) across four therapeutic modalities (columns): HDAC inhibitors (HDACi), EZH2 inhibitors (EZH2i), BET inhibitors (BETi), anti-PD-1 checkpoint blockade- CD39, an exhaustion-associated ectonucleotidase, is most upregulated with anti-PD-1 therapy (+1.5). TOX, a master regulator of exhaustion, shows highest upregulation with BETi (+1.6), suggesting chromatin remodelling can paradoxically reinforce exhaustion programs. H3K27me3, a repressive histone mark, is upregulated with EZH2i (+0.54), consistent with epigenetic plasticity modulation. CD8+ T cell levels are significantly suppressed under EZH2i and BETi treatments (−1.9, −1.7 respectively), possibly indicating impaired cytotoxic re-expansion. IFN-γ, a functional cytokine, is notably downregulated with HDACi (−1.0) and anti-PD-1 (−1.4), reflecting incomplete reinvigoration. B: FTIR Spectroscopy Reveals Exhaustion-Associated Biophysical Changes- This box plot presents FTIR amide I band intensity (indicative of protein secondary structure alterations) across T cell exhaustion states: Non-exhausted T cells exhibit the lowest intensity (~0.75), suggesting minimal structural rearrangement. Early exhausted T cells show intermediate intensity (~1.3), reflecting partial molecular reorganization. Terminally exhausted T cells demonstrate highest intensity (~1.8), pointing to profound biochemical remodelling, possibly due to altered chromatin or mitochondrial stress responses. [Illustration created in PowerPoint]. Note: This figure is illustrative and uses simulated/mock data for conceptual purposes only; it does not represent patient-level or trial data. For definitions of abbreviations (e.g., CUT&Tag, ATAC-seq, EZH2), please refer to the 'Abbreviations' section.
Fundamental of Spectroscopic Techniques
Spectroscopic methods exploit the interaction of electromagnetic radiation with matter to yield highly specific molecular fingerprints. Within immunology and epigenetics, five principal modalities offer high-resolution, real-time analysis.
Raman spectroscopy
Raman spectroscopy relies on the inelastic scattering of monochromatic light (typically a laser) to generate vibrational energy profiles that are characteristic of molecular bonds. Its capacity to differentiate nucleic-acid structures, lipid content and protein conformations without exogenous stains makes it invaluable for monitoring epigenetic states 39. Raman signals are particularly sensitive to histone modifications and DNA methylation, associated with spectral shifts in phosphate and acetyl functional groups 40. Although conventional Raman microscopy is diffraction-limited to sub-micron resolution, advanced approaches such as tip-enhanced Raman spectroscopy (TERS) push sensitivity into the nanoscale. In routine practice, conventional Raman requires approximately 10–10 leukocytes for reproducible spectra, with detection limits in the 10–10 M range. However, signal quality is markedly compromised in FFPE brain tissue because of strong paraffin autofluorescence.
FTIR spectroscopy
Fourier-transform infrared (FTIR) spectroscopy probing molecular vibrations in the mid-infrared region is highly sensitive to chemical modifications in chromatin, including acetylation and methylation, as well as to global metabolic shifts in lipid and carbohydrate pools 41. FTIR also enables mapping of epigenetic compartmentalization within the nucleus through differential absorbance 42. Typically, about 10 cells are required to achieve an adequate signal-to-noise ratio; nevertheless, the method is fully compatible with FFPE sections, enhancing its translational and retrospective value.
UV–Vis absorption spectroscopy
Ultraviolet–visible (UV–Vis) absorption spectroscopy affords rapid quantification of nucleic acids and proteins based on absorbance maxima at 260 nm and 280 nm, respectively. Although less specific than vibrational techniques, it is a useful preliminary or validation tool for assessing cell-state transitions and chromatin compaction 43.
Nuclear magnetic resonance (NMR) spectroscopy
NMR spectroscopy provides atomic-level structural and dynamic information on biomolecules, particularly for elucidating allosteric states of transcription factors, post-translational histone modifications and TCR–pMHC interactions 44. The advent of hyperpolarized NMR has increased sensitivity, permitting real-time monitoring of metabolic intermediates and epigenetic enzyme activities 45.
Hyperspectral imaging (HSI)
Hyperspectral imaging acquires a complete spectrum at every pixel, enabling spatially resolved biochemical characterization of tissues and cellular microenvironments. In immunology, HSI has been instrumental in profiling lymphoid-organ architecture, T-cell trafficking and immune-synapse formation with high spatial fidelity 46. Despite its excellent resolution, HSI generally requires fresh or cryopreserved specimens; compatibility with FFPE material remains limited.
Collectively, these spectroscopic platforms provide a holistic view of immune–epigenetic interfaces, permitting detection of static and dynamic biomolecular features in real time and, in many cases, at single-cell resolution.
Application in Immune Monitoring
T-cell states—including activation, anergy, exhaustion, and memory—are governed by transcriptional and epigenetic heterogeneity. Spectroscopic techniques enable label-free, non-destructive profiling of these states. Raman cytometry discriminates naïve from activated T cells on the basis of lipid, nucleic acid, and metabolite spectral signatures; shifts within the 785–1,600 cm region are indicative of chromatin accessibility 47,48. FTIR spectroscopy detects exhaustion-associated reductions in the amide I/II bands and attenuations of phosphorylation-related peaks at 1,240 cm49,50. Hyperspectral microscopy monitors T-cell subsets in situ by assessing lipid-to-nucleic-acid ratios 51, whereas NMR spectroscopy distinguishes glycolytic effector cells from oxidative memory subsets, thereby correlating metabolic profiles with histone modifications 52,53.
Case Studies in Cancer and Autoimmunity
Spectroscopic approaches have yielded critical insights into immune dysfunction and epigenetic remodeling in cancer and autoimmune diseases. In glioblastoma, Raman spectroscopy successfully distinguishes tumor-infiltrating lymphocytes from peripheral T cells, revealing lipid alterations and nucleic-acid condensation associated with T-cell exhaustion 54. The 1,440-cm CH bending mode, which reflects membrane fluidity, has emerged as a potential non-invasive biomarker of immunosuppression 55. In melanoma, FTIR spectroscopy identifies checkpoint-inhibitor resistance by detecting infrared absorbance shifts linked to histone methylation and effector-gene silencing preceding clinical relapse 56. NMR metabolomics has defined autoimmune signatures, with systemic lupus erythematosus characterised by disrupted choline metabolism and an imbalance in methyl donors 57, whereas rheumatoid arthritis T cells demonstrate FTIR-detectable protein misfolding and lipid peroxidation 58. Hyperspectral imaging of colorectal cancer distinguishes lymphoid from myeloid infiltrates, correlating with patient prognosis and therapeutic response 59. The integration of Raman and FTIR datasets with machine learning achieves >90 % accuracy in predicting immune states and treatment outcomes 60.
Linking Epigenetic Remodeling and Spectroscopic Signatures in GBM T Cells
Glioblastoma (GBM) is a highly immunosuppressive malignancy in which immune cell dysfunction and epigenetic reprogramming converge to induce T-cell exhaustion. Spectroscopic modalities, particularly Raman and Fourier-transform infrared (FTIR) spectroscopy, have emerged as promising, non-destructive approaches for decoding these biochemical and epigenetic alterations in situ. Integrating immune epigenetics with label-free spectroscopic profiling therefore provides a compelling strategy to delineate T-cell states in GBM and may permit real-time monitoring of responses to immunotherapy.
Epigenetic Remodelling in Exhausted GBM T Cells
T-cell exhaustion in the glioblastoma microenvironment is not merely a transient functional state but reflects a profound and stable epigenetic remodelling program. Chromatin accessibility assays in exhausted T cells have revealed global hypoacetylation of enhancers and loss of accessibility at effector loci such as IFNG, PRF1 and TNF, alongside increased accessibility at loci encoding inhibitory receptors such as PDCD1, CTLA4, LAG3 and HAVCR2 (TIM-3) 61. This shift is tightly regulated by a cohort of epigenetic modifiers, including DNMT3A, EZH2 and HDACs, that enforce a repressive chromatin landscape, locking T cells into a dysfunctional state (Table 1) 62. Histone acetylation levels—particularly at H3K27ac and H3K9ac—are decreased in exhausted T cells, leading to chromatin condensation and reduced transcriptional activity. Conversely, increased DNA methylation at key immune-effector genes contributes to their persistent silencing despite antigen stimulation 63. These chromatin alterations are not readily reversible by immune-checkpoint blockade alone, highlighting the need for integrated therapies capable of remodelling the epigenetic architecture of T cells in GBM.
This table summarizes the key epigenetic regulators involved in establishing and maintaining the exhausted phenotype of T cells in the GBM microenvironment. Their modulation has shown promise in combination with checkpoint blockade to reinvigorate T cell function
| Epigenetic Modifier | Molecular Function | Effect on T Cell State in GBM | Mechanistic Outcome |
|---|---|---|---|
| DNMT3A | DNA methyltransferase | Silences effector genes (e.g., IFNG, PRF1) | Promotes fixed exhaustion phenotype |
| EZH2 (PRC2 complex) | H3K27 methylation | Represses memory gene loci | Inhibits T cell reprogramming |
| HDAC1/2 | Histone deacetylases | Reduces histone acetylation at effector genes | Chromatin compaction and transcriptional repression |
| TET2 | DNA demethylase | Promotes DNA demethylation at cytokine loci | Partially restores T cell function |
| BRD4 | Histone acetylation reader | Supports transcriptional elongation of effector genes | Correlates with memory-like phenotype retention |
Hypothetical Spectral Models of Epigenetic States
Spectroscopic modalities such as Raman and FTIR are exquisitely sensitive to the biochemical composition and structural state of chromatin. Raman spectroscopy detects vibrational modes of molecular bonds and can differentiate between open (euchromatic) and condensed (heterochromatic) states on the basis of peak shifts and intensities in phosphate-backbone (PO) and nucleic-acid ring-breathing modes 64. For instance, chromatin decompaction induced by histone acetylation is associated with a relative increase in nucleic-acid-associated Raman peaks (785 cm, 1,090 cm), whereas condensed chromatin states exhibit a dominance of protein and lipid signatures 65. FTIR spectroscopy complements Raman analysis by measuring absorbance in the fingerprint region (1,000–1,800 cm) corresponding to nucleic acids, amide bonds and histone modifications. Notably, acetylation of lysine residues results in shifts within the Amide I and II bands (1,650 and 1,550 cm, respectively), which can be tracked as surrogate markers of histone acetylation levels 66. These spectral alterations support a hypothetical model in which T-cell exhaustion in GBM correlates with a decreased nucleic-acid-to-protein ratio and altered lipid ordering, reflecting underlying chromatin condensation and reduced transcriptional activity (Table 2).
Spectroscopic biomarkers provide a non-invasive window into the biochemical and epigenetic landscape of exhausted T cells in GBM. Raman and FTIR spectra reveal chromatin state, metabolic shifts, and protein modifications, which correlate with immune dysfunction
| Spectroscopic Technique | Key Spectral Markers | Biological Target | Functional Interpretation |
|---|---|---|---|
| Raman Spectroscopy | 785 cm-1 (DNA ring), 1,080 cm-1 (PO2-), 1,655 cm-1 (lipid C=C) | Chromatin, nucleic acids, lipids | Reduced nucleic acid intensity → transcriptional inactivity; lipid disordering → altered metabolism |
| FTIR Spectroscopy | 1,650 cm-1 (Amide I), 1,550 cm-1 (Amide II), 1,080 cm-1 (PO4-) | Histones, protein backbone, DNA | Altered Amide I/II ratio reflects histone acetylation levels; phosphodiesterase shifts → chromatin compaction |
| Hyperspectral Imaging | Composite shifts across 1,000–1,800 cm-1 | Whole-cell biochemical signature | Classifies immune cell functional states; identifies spatial heterogeneity in TIL exhaustion |
| Surface-enhanced Raman (SERS) | Enhanced signals at nucleic acid + protein peaks | Signal amplification in CSF-derived T cells | Enables detection of exhausted T cells in liquid biopsy platforms |
Biochemical Spectroscopic Signatures of Exhausted T Cells
Exhausted T cells exhibit distinct biochemical phenotypes characterized by altered metabolic activity, increased reactive oxygen species (ROS), lipid peroxidation and changes in membrane composition, all of which can be detected spectroscopically 67. Raman mapping of GBM-infiltrating T cells has revealed decreased lipid unsaturation (C=C stretching at ~1,655 cm), altered protein secondary structure (amide III) and reduced nucleic-acid content, findings consistent with a senescent or metabolically suppressed phenotype 68. Spectral markers such as the 1,445 cm CH scissoring band (indicative of membrane saturation) and the 1,080 cm phosphate stretch (DNA/RNA) provide quantitative indicators of the exhaustion state. These observations suggest that Raman and FTIR spectroscopy can detect functionally relevant biochemical changes in T cells that are not apparent from surface-marker profiling alone.
CSF- and Biopsy-Derived Spectral Fingerprinting
Cerebrospinal fluid (CSF) and GBM tumour biopsies represent minimally invasive sources for immune profiling. Recent advances in hyperspectral Raman microscopy and confocal FTIR mapping have enabled single-cell-resolution analysis of immune populations directly from clinical samples 69. For instance, T cells isolated from GBM CSF exhibit significant down-regulation of nucleic-acid spectral regions compared with peripheral T cells, reflecting reduced transcriptional activity and exhaustion 70. Moreover, biopsy-derived T cells from the GBM core and peritumoral regions display distinct FTIR and Raman fingerprints. These spatially resolved signatures correspond to differential epigenetic and metabolic states sculpted by the local tumour microenvironment, underscoring the potential of spectroscopic fingerprinting as both a diagnostic and stratification tool 71.
Integration with Single-Cell Omics
Combining label-free spectroscopy with single-cell omics approaches such as scRNA-seq and scATAC-seq yields a multidimensional view of T-cell exhaustion. For example, single-cell Raman spectroscopy coupled with transcriptomic profiling (Raman-seq) permits correlative mapping of spectral features with gene expression and chromatin accessibility at the individual-cell level 72. Integration with scATAC-seq further reveals spectral correlates of open versus closed chromatin, particularly at exhaustion-specific loci. This integrative framework has already been applied in pre-clinical glioma models to identify subpopulations of T cells that retain effector potential despite chronic stimulation 73. By training machine-learning algorithms on multimodal datasets (Raman + scRNA-seq), investigators can classify T cells into functional states with high accuracy and predict responsiveness to immune-checkpoint inhibitors or epigenetic modulators.
Therapeutic Implications and Pathways to Reinvigoration
The immunosuppressive microenvironment in glioblastoma (GBM) constitutes a formidable barrier to immune checkpoint inhibitors (ICIs), because stable T-cell exhaustion programs are perpetuated by epigenetic, metabolic, and transcriptional rewiring. Reversal of these dysfunctional states will require mechanism-driven, precision-guided therapeutic interventions. Accordingly, integrating epigenetic reprogramming, spectroscopy-based monitoring and combinatorial immunotherapeutic strategies provides a rational framework for reinvigorating anti-tumor immunity in GBM.
Epigenetic Reprogramming to Reverse T-Cell Exhaustion
T-cell exhaustion in GBM is stabilized by epigenetic programs that repress effector gene loci and sustain inhibitory receptor expression. Reversible exhaustion retains partial chromatin accessibility and remains partially responsive to ICIs, whereas fixed exhaustion is characterized by near-complete transcriptional silencing and resistance to checkpoint blockade 84. Histone deacetylase (HDAC) inhibitors such as vorinostat and panobinostat can restore IFN-γ, granzyme B and IL-2 expression, thereby synergizing with PD-1 blockade 85. Bromodomain and extra-terminal (BET) inhibitors (e.g., JQ1) interrupt TOX/NR4A-driven dysfunction 86, whereas enhancer of zeste homolog 2 (EZH2) inhibitors (e.g., tazemetostat) de-repress Tcf7 and Runx3, promoting memory-like states 87. Nonetheless, excessive transcriptional de-repression may precipitate T-cell apoptosis 88. Single-cell ATAC-seq analyses confirm that fixed exhaustion is associated with rigid chromatin landscapes, emphasizing the relevance of epigenetic targeting 89.
Spectroscopy-Guided Monitoring of Therapy
Traditional immunomonitoring modalities such as flow cytometry and bulk transcriptomics require cellular labeling and sample manipulation, whereas label-free spectroscopic platforms—including Raman, Fourier-transform infrared (FTIR) and hyperspectral imaging—provide real-time, in situ molecular readouts. In GBM-infiltrating T-cells, these modalities can detect chromatin condensation, lipid peroxidation and protein conformational changes associated with exhaustion or reinvigoration 90. Diagnostic spectral signatures include the 785 cm DNA ring vibration, the 1,080 cm phosphodiester stretch and the 1,650 cm amide-I band, all reflective of chromatin and protein remodeling. Raman-derived heatmaps illustrate intratumoral heterogeneity, with reinvigorated T-cells localizing to tumor margins and exhausted subsets enriched within necrotic cores 91,92. Ongoing clinical trials are incorporating spectroscopy coupled with artificial intelligence to predict therapeutic outcomes 93.
Combinatorial Therapeutic Approaches
Given the multifactorial drivers of T-cell exhaustion in GBM, monotherapy with either ICIs or epigenetic agents is frequently inadequate. Current rational strategies therefore prioritize combinatorial regimens that integrate ICIs, epigenetic modulators and metabolic adjuvants, guided by spectroscopic profiling. In preclinical glioma models, anti-PD-1 therapy combined with HDAC or EZH2 inhibitors augments intratumoral T-cell proliferation, cytokine secretion and memory-like differentiation (Figure 4). This synergy results from transcriptional reactivation of effector genes together with relief of chromatin-mediated immunosuppression 94. Incorporation of metabolic adjuvants—such as mTOR modulators, NAD precursors (e.g., nicotinamide riboside) or fatty-acid-oxidation inducers—further mitigates metabolic paralysis and restores mitochondrial fitness 95. Spectroscopy can detect these functional shifts through alterations in lipid saturation indices, NADH/FAD fluorescence and redox-sensitive spectral bands, thereby enabling real-time monitoring 96. Early-phase clinical trials evaluating triplet combinations (anti-PD-1 + HDAC inhibitor + metabolic modulator) have reported increased tumor-infiltrating lymphocyte density and partial restoration of TCR clonality, with spectroscopy embedded as a non-invasive endpoint 97 (Figure 4). Spectroscopy-derived biosignatures can also stratify exhaustion subtypes—for example, selecting BET inhibition for TOX-driven states or mTOR modulation for glycolytic dysfunction. Ultimately, spectroscopy-guided adaptive therapy, whereby spectral dynamics dictate treatment adjustments, may minimize toxicity while maintaining immune surveillance. Collectively, epigenetic, metabolic and checkpoint-directed combinations that are dynamically informed by spectral biomarkers represent a transformative frontier in GBM immunotherapy (Figure 4).
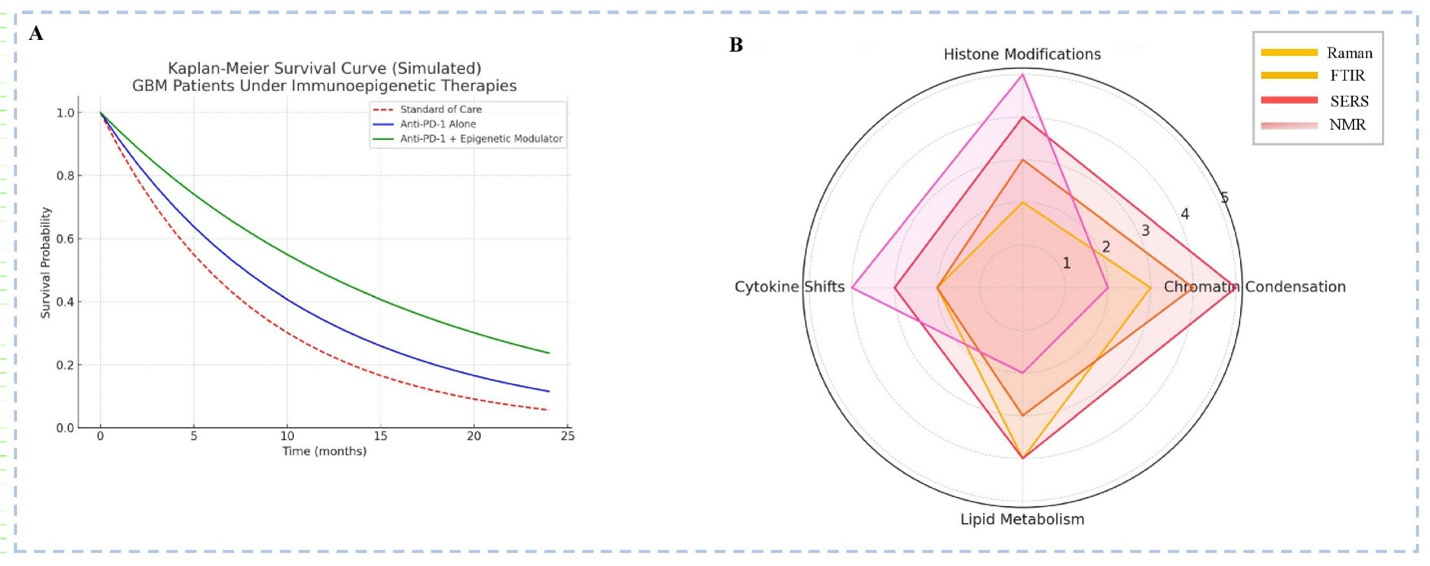
Integrative Assessment of Immunoepigenetics Therapies and Spectroscopic Biomarkers in Glioblastoma (GBM) (A)
Discussion
This synthesis underscores the potential of integrating spectroscopic technologies with immuno-epigenetic profiling to elucidate T-cell exhaustion in glioblastoma (GBM), a setting in which current immunotherapies remain largely ineffective. T-cell dysfunction arises from chronic antigen stimulation, metabolic constraints, and tumor-induced epigenetic fixation. Although immune-checkpoint inhibitors (ICIs) have transformed outcomes in several malignancies, their limited efficacy in GBM is attributable to stable chromatin configurations that constrain reinvigoration 98. Exhausted CD8 T cells exhibit DNA methylation at effector loci and open chromatin at inhibitory genes such as Pdcd1, Lag3, and Tox—epigenetic signatures that persist despite PD-1 blockade 99. Repressive histone modifications, particularly H3K27me3 enrichment mediated by EZH2, further reinforce gene silencing and resemble senescence-like differentiation 100. Histone-deacetylase (HDAC) and bromodomain and extra-terminal (BET) inhibitors can partially reverse these states, but predicting clinical responsiveness remains challenging 101.
Spectroscopic methodologies offer non-invasive strategies to interrogate such epigenetic programs. Raman spectroscopy, Fourier-transform infrared (FTIR) spectroscopy, and surface-enhanced Raman scattering (SERS) can identify vibrational fingerprints of nucleic acids, lipids, and histones with high sensitivity 102. FTIR discriminates methylated from unmethylated DNA 103, whereas SERS detects histone acetylation associated with HDAC inhibition 104. Accordingly, these techniques could produce real-time epigenetic maps that quantify the severity of exhaustion. Combination therapies that target EZH2, DNA methyltransferases (DNMTs), or BET proteins in conjunction with ICIs have demonstrated T-cell reinvigoration in glioma models 105; however, their effectiveness depends on intervention before terminal exhaustion becomes irreversible. Spectroscopy may therefore aid in defining this therapeutic window, particularly when integrated with nuclear magnetic resonance (NMR)-based metabolic profiling 106.
The immunosuppressive GBM microenvironment—characterized by tumor-associated macrophage (TAM) polarization, TGF-β signaling, and nutrient competition—further entrenches exhaustion 107. Hyperspectral imaging delineates spatial immune heterogeneity 108, while FTIR links lipid peroxidation and chromatin condensation to CD8 dysfunction 109. Integrating spectroscopy with multi-omics datasets and artificial-intelligence classifiers, which achieve >90 % predictive accuracy in other cancers 110, could enable precise, real-time monitoring of T-cell reinvigoration and guide adaptive, patient-specific immunotherapy. Nevertheless, several in-vivo cranial-window Raman spectroscopy studies have failed to consistently detect leukocytes owing to pronounced autofluorescence and motion artifacts, highlighting the translational gap between bench-top sensitivity and clinical applicability.
Future Perspectives and Translational Roadmap
The translation of spectroscopic immunoprobing from proof-of-concept to clinical practice requires methodological harmonization, computational innovation, and integrated translational pipelines (Figure 5). Despite encouraging studies, reproducibility remains limited by variability in calibration, acquisition, and preprocessing, as well as inter-patient heterogeneity in GBM. Standardized spectral biomarker definitions and a curated multi-centre spectral atlas linking fingerprints to transcriptomic and epigenomic features are indispensable 111,112. Building on immune-scoring paradigms, a Spectral Exhaustion Index (SEI) could be developed, integrating vibrational markers of histone deacetylation (~1450 cm), DNA methylation (~1230–1280 cm), lipid peroxidation (~1740 cm), and metabolic flux (NAD/NADH ratios), thereby enabling dynamic tracking of exhaustion and therapeutic responsiveness 113. Validation in GBM organoid–T-cell co-cultures, followed by clinical deployment, will be essential. AI-driven pipelines, particularly CNNs and VAEs, already classify immune subsets with >90 % accuracy; however, future models must be interpretable and integrate multi-omics layers, including ATAC-seq and single-cell transcriptomics 114,115. Federated learning could accelerate cross-institutional validation while preserving data privacy. Successful translation further demands interdisciplinary collaboration across immunology, neurosurgery, spectroscopy, computational biology, and regulatory science. Incorporating spectral endpoints in trials and training “spectro-immunologists” will be pivotal 116. Ultimately, embedding standardized spectral indices within multimodal clinical workflows could reshape precision immunotherapy for GBM.
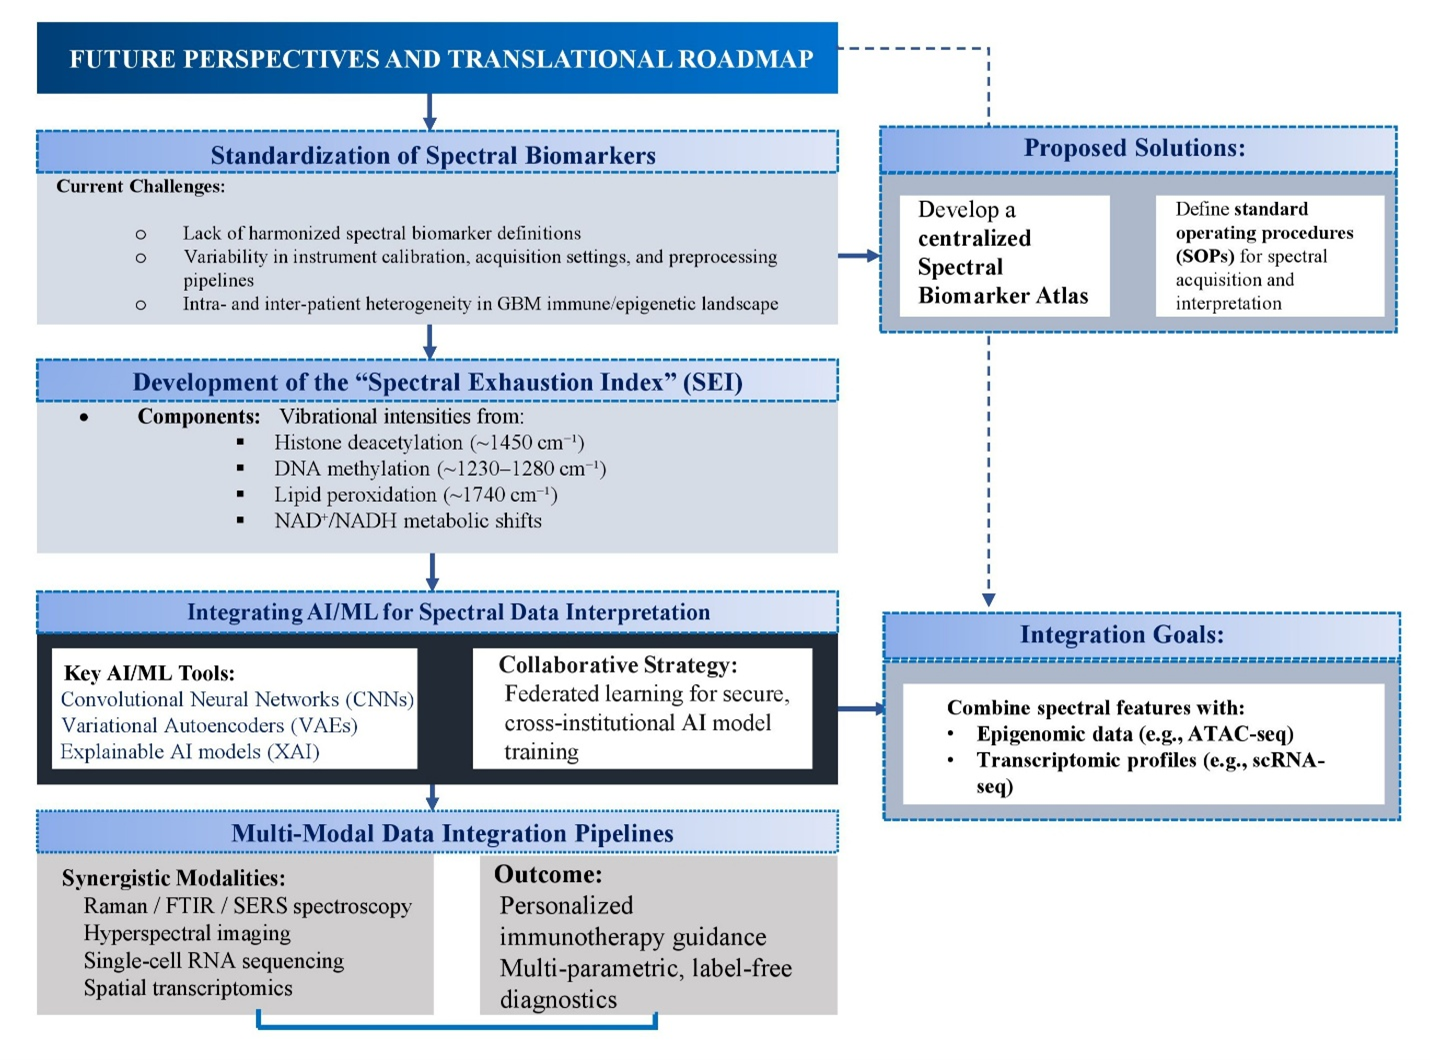
Flowchart illustration of Future Perspectives and Translational Roadmap [Illustration created in PowerPoint].
Conclusion
Glioblastoma (GBM) remains highly resistant to immunotherapy, primarily because of deeply entrenched, epigenetically fixed T-cell exhaustion. Conventional transcriptomic and proteomic methods offer only limited resolution of the molecular and functional heterogeneity that underpins this dysfunction. Label-free spectroscopic platforms—including Raman, Fourier-transform infrared (FTIR) spectroscopy, surface-enhanced Raman scattering (SERS), and hyperspectral imaging—provide real-time, in situ interrogation of biochemical and chromatin-associated signatures, thereby enabling generation of precise spectral fingerprints of exhaustion. When integrated with artificial-intelligence-driven analytics, spatial omics, and multimodal imaging, these technologies facilitate the development of standardized metrics, such as a “spectral exhaustion index,” to quantify immune status, track therapy-induced reinvigoration, and predict responsiveness to checkpoint blockade or epigenetic modulators. Translation of these tools into clinical workflows could permit dynamic, patient-specific treatment adaptation, early detection of therapeutic resistance, and identification of optimal windows for reversal of exhaustion. The convergence of spectroscopy, epigenetics, immunotherapy, and computational intelligence thus offers a transformative framework that moves beyond passive observation toward active reshaping of the GBM immune ecosystem, ultimately enabling precision-guided immuno-oncology interventions.
Abbreviations
ATAC-seq: Assay for Transposase-Accessible Chromatin using sequencing; BET: Bromodomain and Extra-Terminal domain; CNS: Central Nervous System; CSF: Cerebrospinal Fluid; CUT&Tag: Cleavage Under Targets and Tagmentation; ChIP-seq: Chromatin Immunoprecipitation sequencing; DNMT: DNA Methyltransferase; ECAR: Extracellular Acidification Rate; FTIR: Fourier-Transform Infrared Spectroscopy; GBM: Glioblastoma Multiforme; HDAC: Histone Deacetylase; HSI: Hyperspectral Imaging; ICI: Immune Checkpoint Inhibitor; IFN-γ: Interferon-gamma; IL: Interleukin; MSI: Mass Spectrometry Imaging; NAD/NADH: Nicotinamide Adenine Dinucleotide (oxidized/reduced); NMR: Nuclear Magnetic Resonance; PD-1: Programmed Cell Death Protein 1; PRC2: Polycomb Repressive Complex 2; ROS: Reactive Oxygen Species; SERS: Surface-Enhanced Raman Spectroscopy; SEI: Spectral Exhaustion Index; TAM: Tumor-Associated Macrophage; TCR: T Cell Receptor; Tex: Exhausted T Cell; TIDE: Tumor Immune Dysfunction and Exclusion; TIL: Tumor-Infiltrating Lymphocyte; TME: Tumor Microenvironment; TNF-α: Tumor Necrosis Factor-alpha; TOX: Thymocyte Selection-Associated High Mobility Group Box; scRNA-seq: Single-Cell RNA Sequencing
Acknowledgments
None.
Author’s contributions
As a sole author, I confirm that I have conceived the study, designed the methodology, conducted the research, created all the illustrations independently, analysed the data, and wrote the manuscript. I also affirm full responsibility for all aspects of the work, ensuring the integrity and accuracy of the study.
Funding
None.
Availability of data and materials
Not applicable.
Ethics approval and consent to participate
Not applicable.
Consent for publication
Not applicable.
Declaration of generative AI and AI-assisted technologies in the writing process
AI-assisted tools were used solely for language refinement of select sections (Abstract, Introduction, Discussion). All scientific content, conceptual framing, data interpretation, and figure design remain the authors’ own. Full responsibility for the manuscript content is retained by the authors.
Competing interests
The authors declare that they have no competing interests.